Logs with Python
Use Logs for Lumigo with our Python Distribution.
Overview
Lumigo's logging instrumentation for Python seamlessly integrates with the native logging library. This integration automatically captures and forwards log data to the Lumigo platform without requiring significant code changes. The instrumentation hooks into the Python logging system and enhances logs with additional metadata, including trace correlation information when available.
When you instrument your application with Lumigo, logs emitted via the Python logging module are automatically captured. If the log is created within an active span, it is enriched with trace identifiers, enabling deep observability and correlation between logs and traces. This allows for efficient debugging, better performance monitoring, and a comprehensive view of your application's behavior.
The process is compatible with both automatic and manual instrumentation methods, making it easy to adopt Lumigo's enhanced logging capabilities without disrupting existing workflows.
Scope
When working with Logs for Lumigo through Python, the only logger supported is the native logging library available by default.
Basics
Instrumentation Setup
How to work with logging on the platform
Ensure that Lumigo's OpenTelemetry distribution for Python is properly instrumented in your application. Follow the instructions in Instrumentation Setup to properly instrument the distribution. Use the native Python logging module to emit logs.
For example, when executing logger.info('Hello Lumigo!', {'some': 'key', 'some-other': 'key'}), you should see the following in the Lumigo platform logs page:
- The log message: "Hello Lumigo!"
- Any additional context (e.g.,
{'some': 'key', 'some-other': 'key'}) included as structured data. - Metadata such as timestamp, log level (INFO), and other trace-related information if the log is emitted within an active span context.
To view, search, and filter logs based on these attributes, navigate to Lumigo's page.
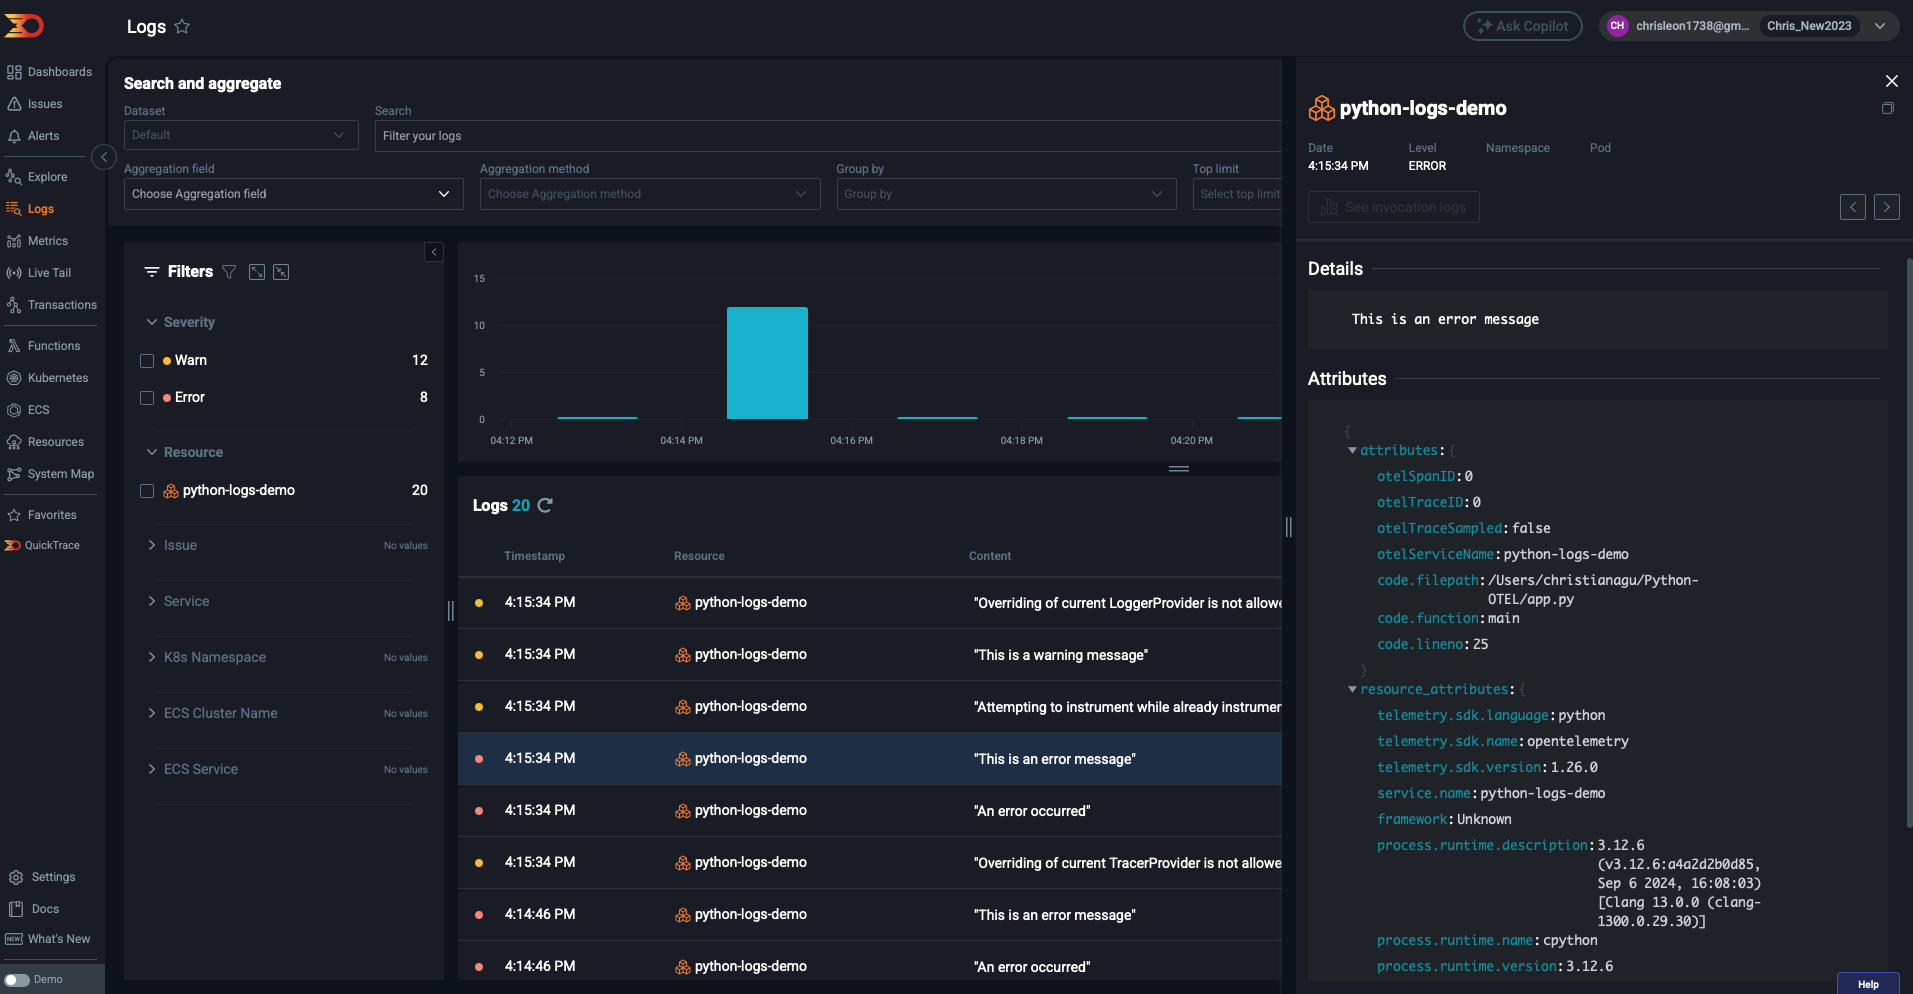
A log emitted by Python in the Lumigo Platform
Logging within an active span context
Ensure your application is instrumented using the Lumigo OpenTelemetry distribution. When a log is emitted within an active span, Lumigo automatically correlates the log with the corresponding trace.
AUTOWRAPT_BOOTSTRAP=lumigo_opentelemetryimport lumigo_opentelemetryBenefits of logs/traces correlation:
- Improved observability by connecting logs with application traces.
- Easier troubleshooting through end-to-end visibility.
In the Lumigo platform, you can view the correlated logs under the respective trace, providing comprehensive debugging context.
To test logging with Python:
import os
import logging

os.environ["LUMIGO_TRACER_TOKEN"] = "your-token-here"
os.environ["LUMIGO_DEBUG"] = "true"
os.environ["LUMIGO_ENABLE_LOGS"] = "true"
os.environ["OTEL_SERVICE_NAME"] = "python-logs-demo"
from lumigo_opentelemetry import init, logger_provider

init()

# Configure logging
logging.basicConfig(level=logging.INFO)
logger = logging.getLogger(__name__)

def main():
    # Log different levels
    logger.debug("This is a debug message")
    logger.info("This is an info message")
    logger.warning("This is a warning message")
    logger.error("This is an error message")

    logger.info("User action", extra={
        "user_id": "123",
        "action": "login",
        "timestamp": "2024-03-20T10:00:00Z"
    })

    try:
        raise ValueError("Something went wrong")
    except Exception as e:
        logger.error("An error occurred", exc_info=True)

if __name__ == "__main__":
    main()


# ... the rest of the code ...

# Now the app can terminate, with all the logs sent to Lumigo
logger_provider.force_flush()
Advanced Options
Troubleshooting cases where logs are not being sent
If logs are not appearing in the Lumigo platform, enable the LUMIGO_DEBUG_LOGDUMP environment variable.
LUMIGO_DEBUG_LOGDUMP: This functions similarly to LUMIGO_DEBUG_SPANDUMP, but for logs instead of spans. This option is only effective when LUMIGO_ENABLE_LOGS is set to true.
This outputs additional debug information to help diagnose why logs are not being sent. Check the application logs for messages prefixed with [Lumigo Log Dump] to identify potential issues. You should also ensure the Lumigo instrumentation is correctly initialized and verify network connectivity to Lumigo's backend.
Troubleshooting cases where logs are not correlated to traces
Verify that logs are emitted within an active span, and use the Lumigo debug logs (LUMIGO_DEBUG_LOGDUMP) to inspect log traces and diagnose correlation issues. You should also ensure the Lumigo distribution is up-to-date and correctly configured for your environment.
Cases not covered by the distribution
We do not cover every scenario with our distribution. For example, if your code has print("something") as opposed to logger.info("something"), the print version will not make it to Lumigo. We do not instrument those calls, but instead instrument only calls for logger.x() if the logger comes from the logging package.
Lumigo also does not cover any logs based on non-native libraries. Make sure to only use Python's native logging module. For example, using Loguru:
from loguru import logger

logger.debug("That's it, beautiful and simple logging!")
Will not have the logs show up in Lumigo, as Loguru is not instrumented by us, and is not based on Python's native logging module.
For scenarios not covered by Lumigo's distribution, we have several alternate setups you can use:
- Vanilla OpenTelemetry setup : Implement standard OpenTelemetry instrumentation for advanced use cases.
- Kubernetes log collection : Use a centralized log collector (e.g., Fluent Bit, Fluentd) to aggregate and forward logs.
Refer to Lumigo documentation for detailed guidance on integrating with these alternative setups.
Updated 7 months ago