Kubernetes Single Workload Page
Kubernetes Single Workload Page
Lumigo’s Kubernetes Single Workload page is designed to give you detailed, workload-specific observability for faster troubleshooting and performance monitoring. Whether you're managing a Deployment, StatefulSet, or DaemonSet, this page provide all the context you need in one place.
To reach the page, navigate to the Kubernetes Cluster Workloads Page and click on the workload you want. It will lead you to the Single Workload Page, open on the Overview Tab.
Overview Tab
The Single Workload Overview tab provides a centralized summary of your workloads' operational state and recent activity. Use this tab to quickly understand the behavior of your workloads and identify potential issues.
Features
Below are some of the features we offer with the Overview tab.
- CPU & Memory Utilization Trends: View real-time and historical resource usage across all pods in the workload. This helps detect spikes, inefficiencies, or bottlenecks.
- Kubernetes Events and Rollouts: Track deployment rollouts and view Kubernetes event logs in context, making it easy to identify when changes occurred and how they impacted the workload.
- Error Logs Over Time: Monitor error logs to detect patterns and anomalies, and pinpoint when issues began.
Use the overview tab when you are diagnosing performance issues, verifying the impact of recent deployments, or getting a fast overview without diving into pod-level details.
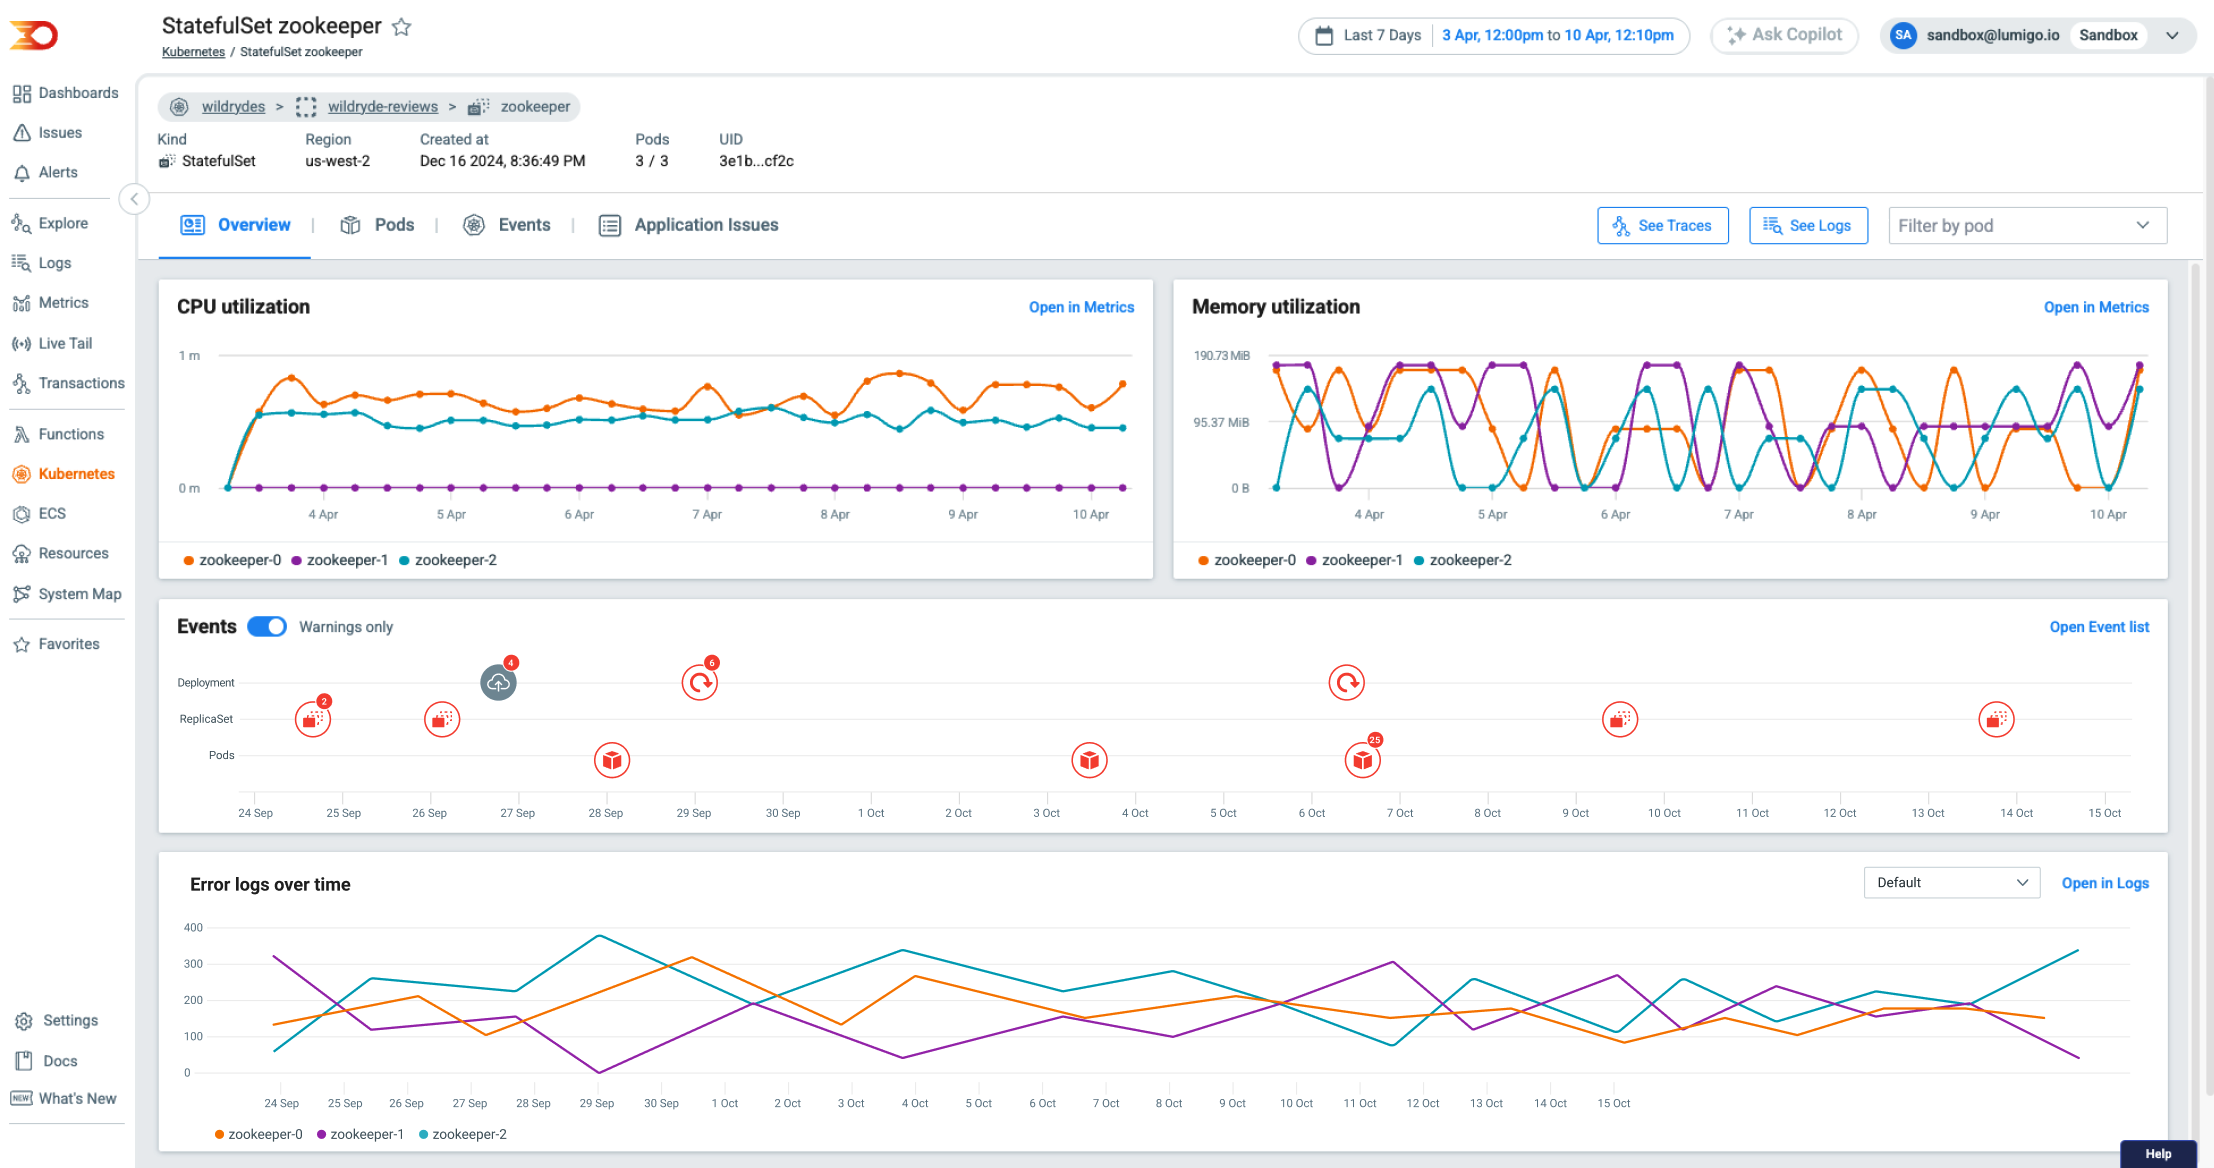
Overview tab for Kubernetes Workload
Pods Tab
The Single Workload Pods tab gives you a detailed breakdown of each pod within the selected workload. This tab is ideal for detailed monitoring of the health and behavior of individual pods and their containers.
Features
Below are some of the features we offer with the Pods tab.
- Pod Status at a Glance: Instantly identify running, pending, or failed pods.
- Pod Restarts and Age: Track pod lifecycle information to catch instability or frequent restarts.
- Per-Pod Resource Usage and Node Info: Examine CPU and memory usage for each pod, along with node assignment details.
- Container Health Insights: Get status indicators for every container running in each pod, helping you isolate container-specific issues.
- Quick Access to Logs & Traces: Click through to full logs and distributed traces for fast root cause analysis.
Use the Pods tab when you are in need of a more in-depth and detailed approach, such as when investigating failing or restarting pods, debugging container-level errors, or following logs and traces from specific, individual pods.
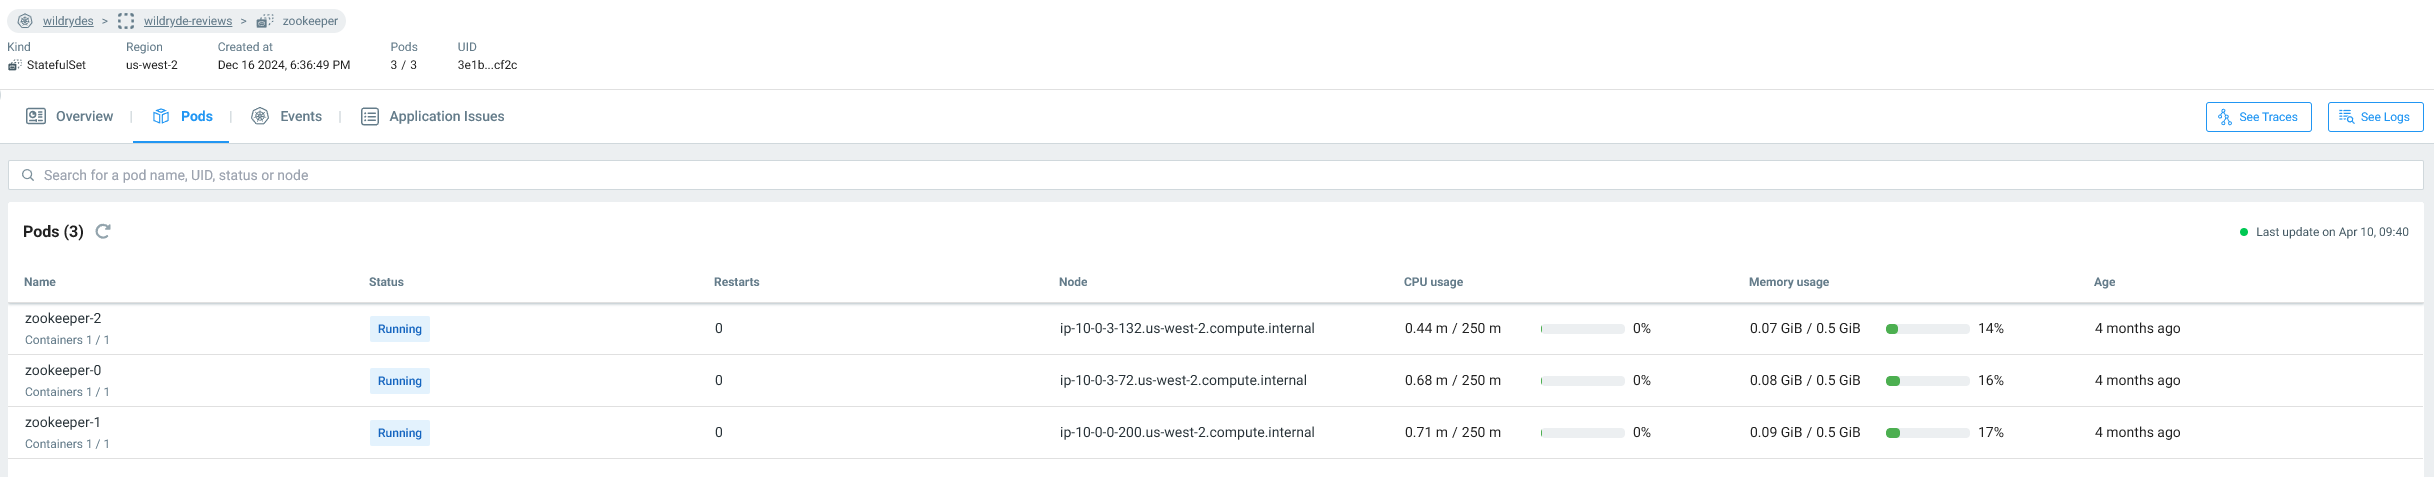
Pods tab for Kubernetes Workload
Events Tab
A comprehensive, time-ordered list of events. Each entry includes the event reason, detailed message, and the associated resource—giving you clear insight into what’s happening in your cluster and why it is happening.
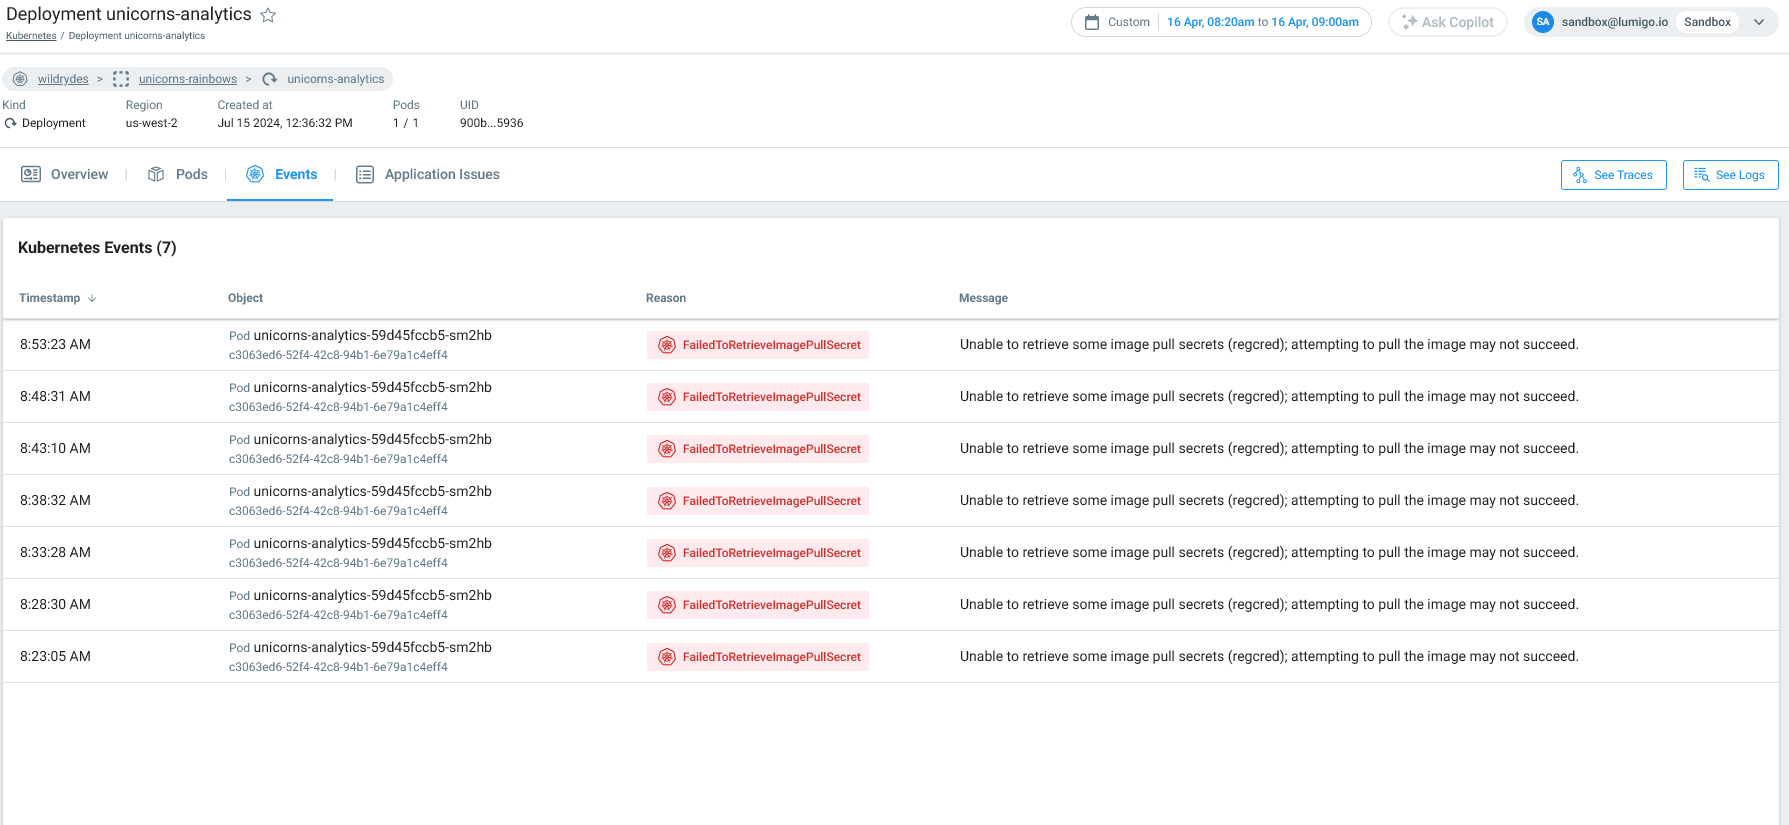
Events tab for Kubernetes Workload
Application Issues Tab
Gain deep application context within your Kubernetes environment through an aggregated table of all applicative issues detected across your workloads. Powered by distributed tracing, this view highlights the error messages and occurrence trends. Each issue links directly to the latest invocation for a detailed root-cause analysis and troubleshooting experience.
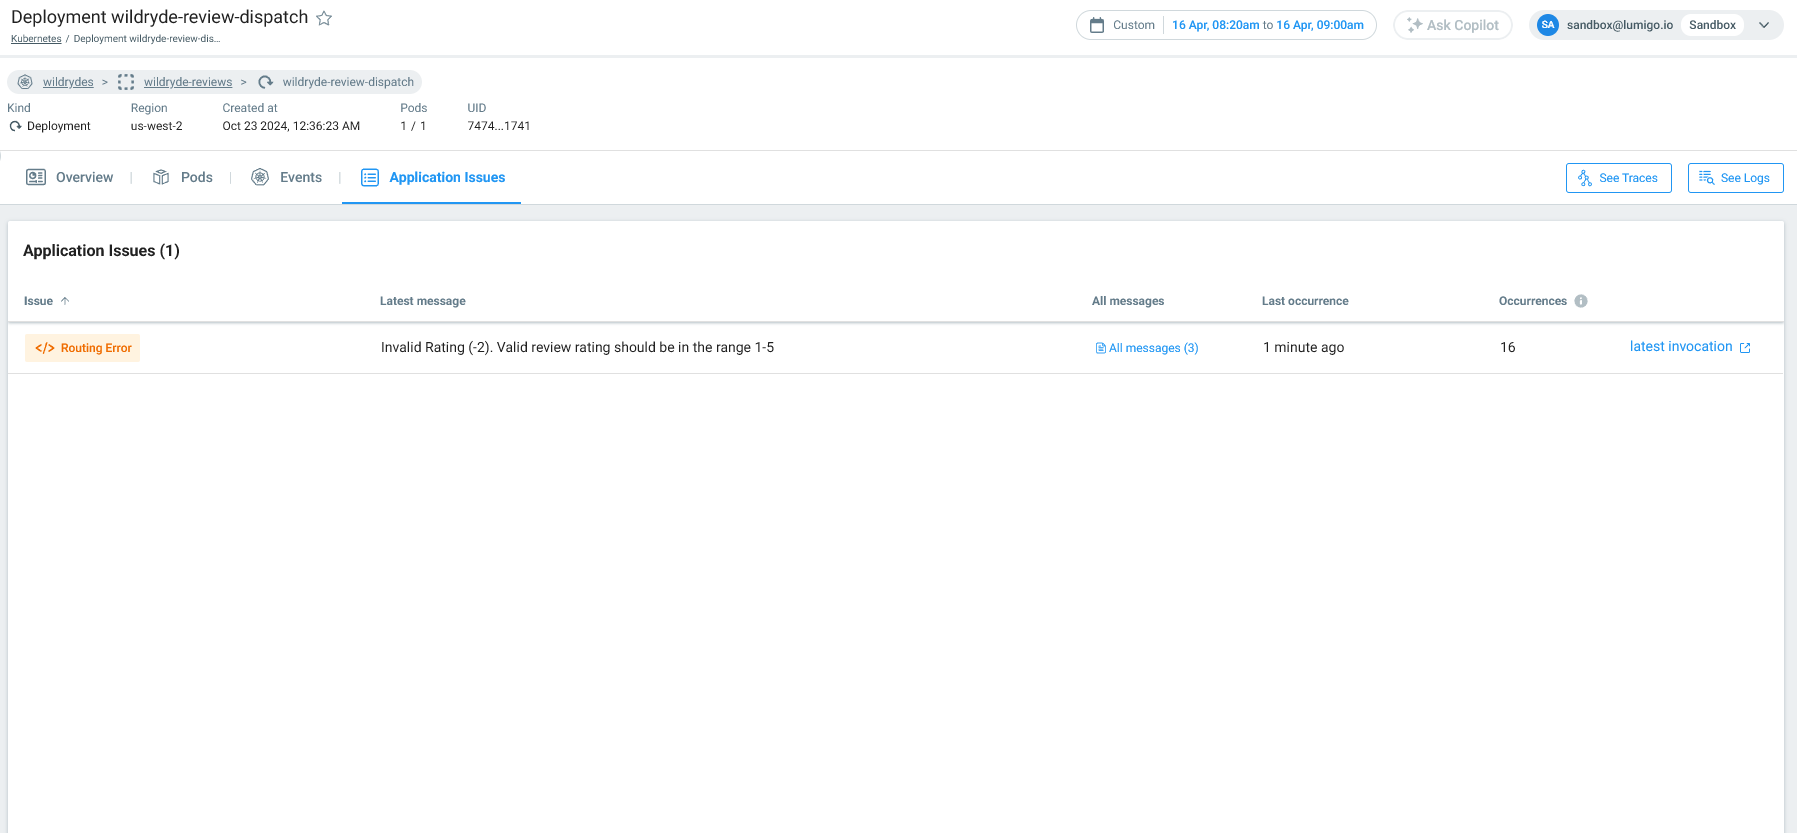
Application Issues tab for Kubernetes Workload