Function Details View
The Function Details View allows you to analyze the behavior and performance of individual functions with greater granularity, and to examine individual invocations with easy access to corresponding traces.
For each function, the page displays:
- Function profile
- Invocations
- Metrics
- Logs
Function Profile
The function profile view displays detailed information about the function’s configuration:
- Function name, region and runtime.
- Last modified date, timeout, memory limit.
- Ephemeral storage, concurrency, architecture, SnapStart and description.
- Tracing Status

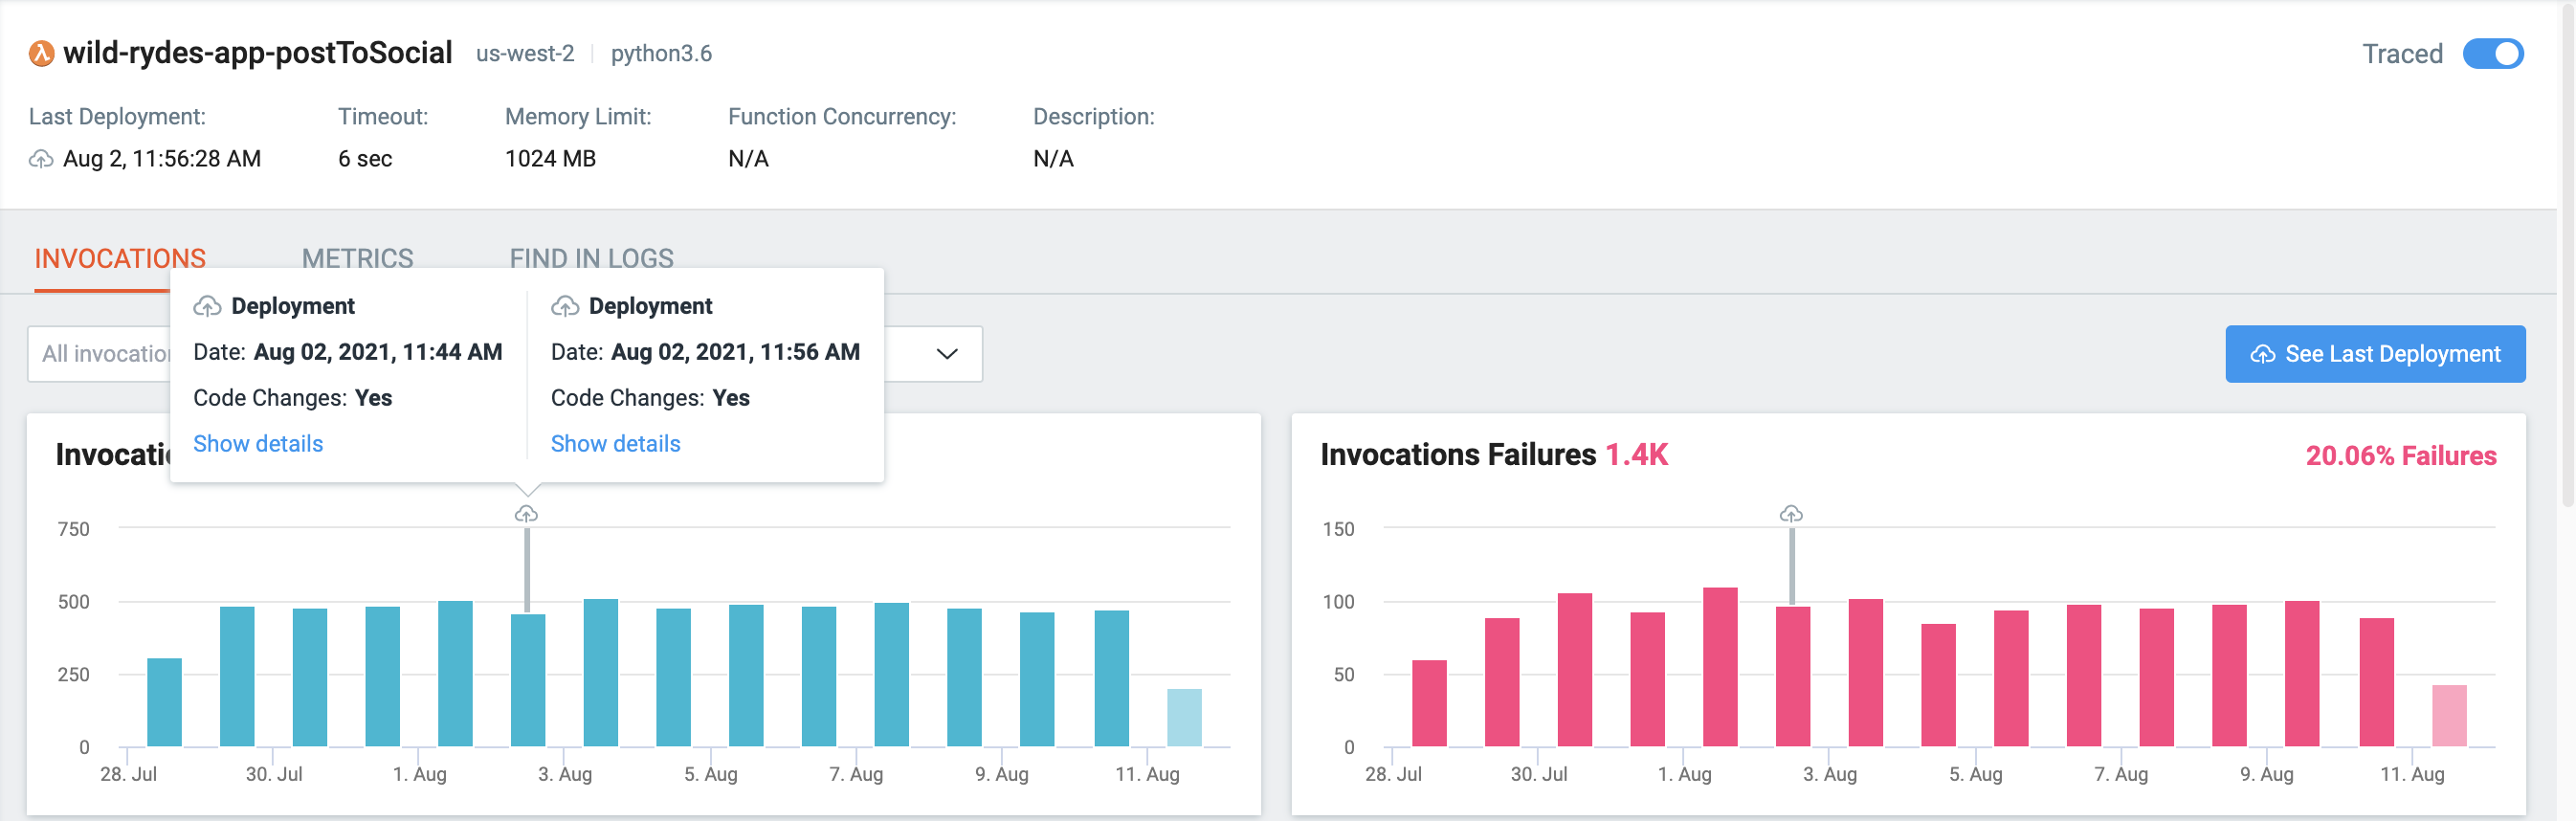
Invocations
The function invocations view displays detailed information about the invocations for the selected time frame. It consists of graphs that show the number of invocations, number of invocation failures, and a list of invocations in the form of a table.
For every invocation, you can retrieve the following: request ID, start time, result, duration, cold start, Execution Tags, the component which triggered the invocation, and issues.
You can click on an invocation to open the Transaction View to drill down into the details of the invocation as it propagate from the function.

Tip: Filter by Execution TagsYou can easily filter invocations by their execution tags. Lumigo will automatically add some tags to your invocations, but adding custom execution tags can improve focus and efficiency dramatically!
Function Deployments
Function Deployments provide information about the latest deployments of the specific function, and help to understand if changes in configuration or a new version of code causes an unexpected outcome, such as an increase in the number of invocation failures or degraded performances.
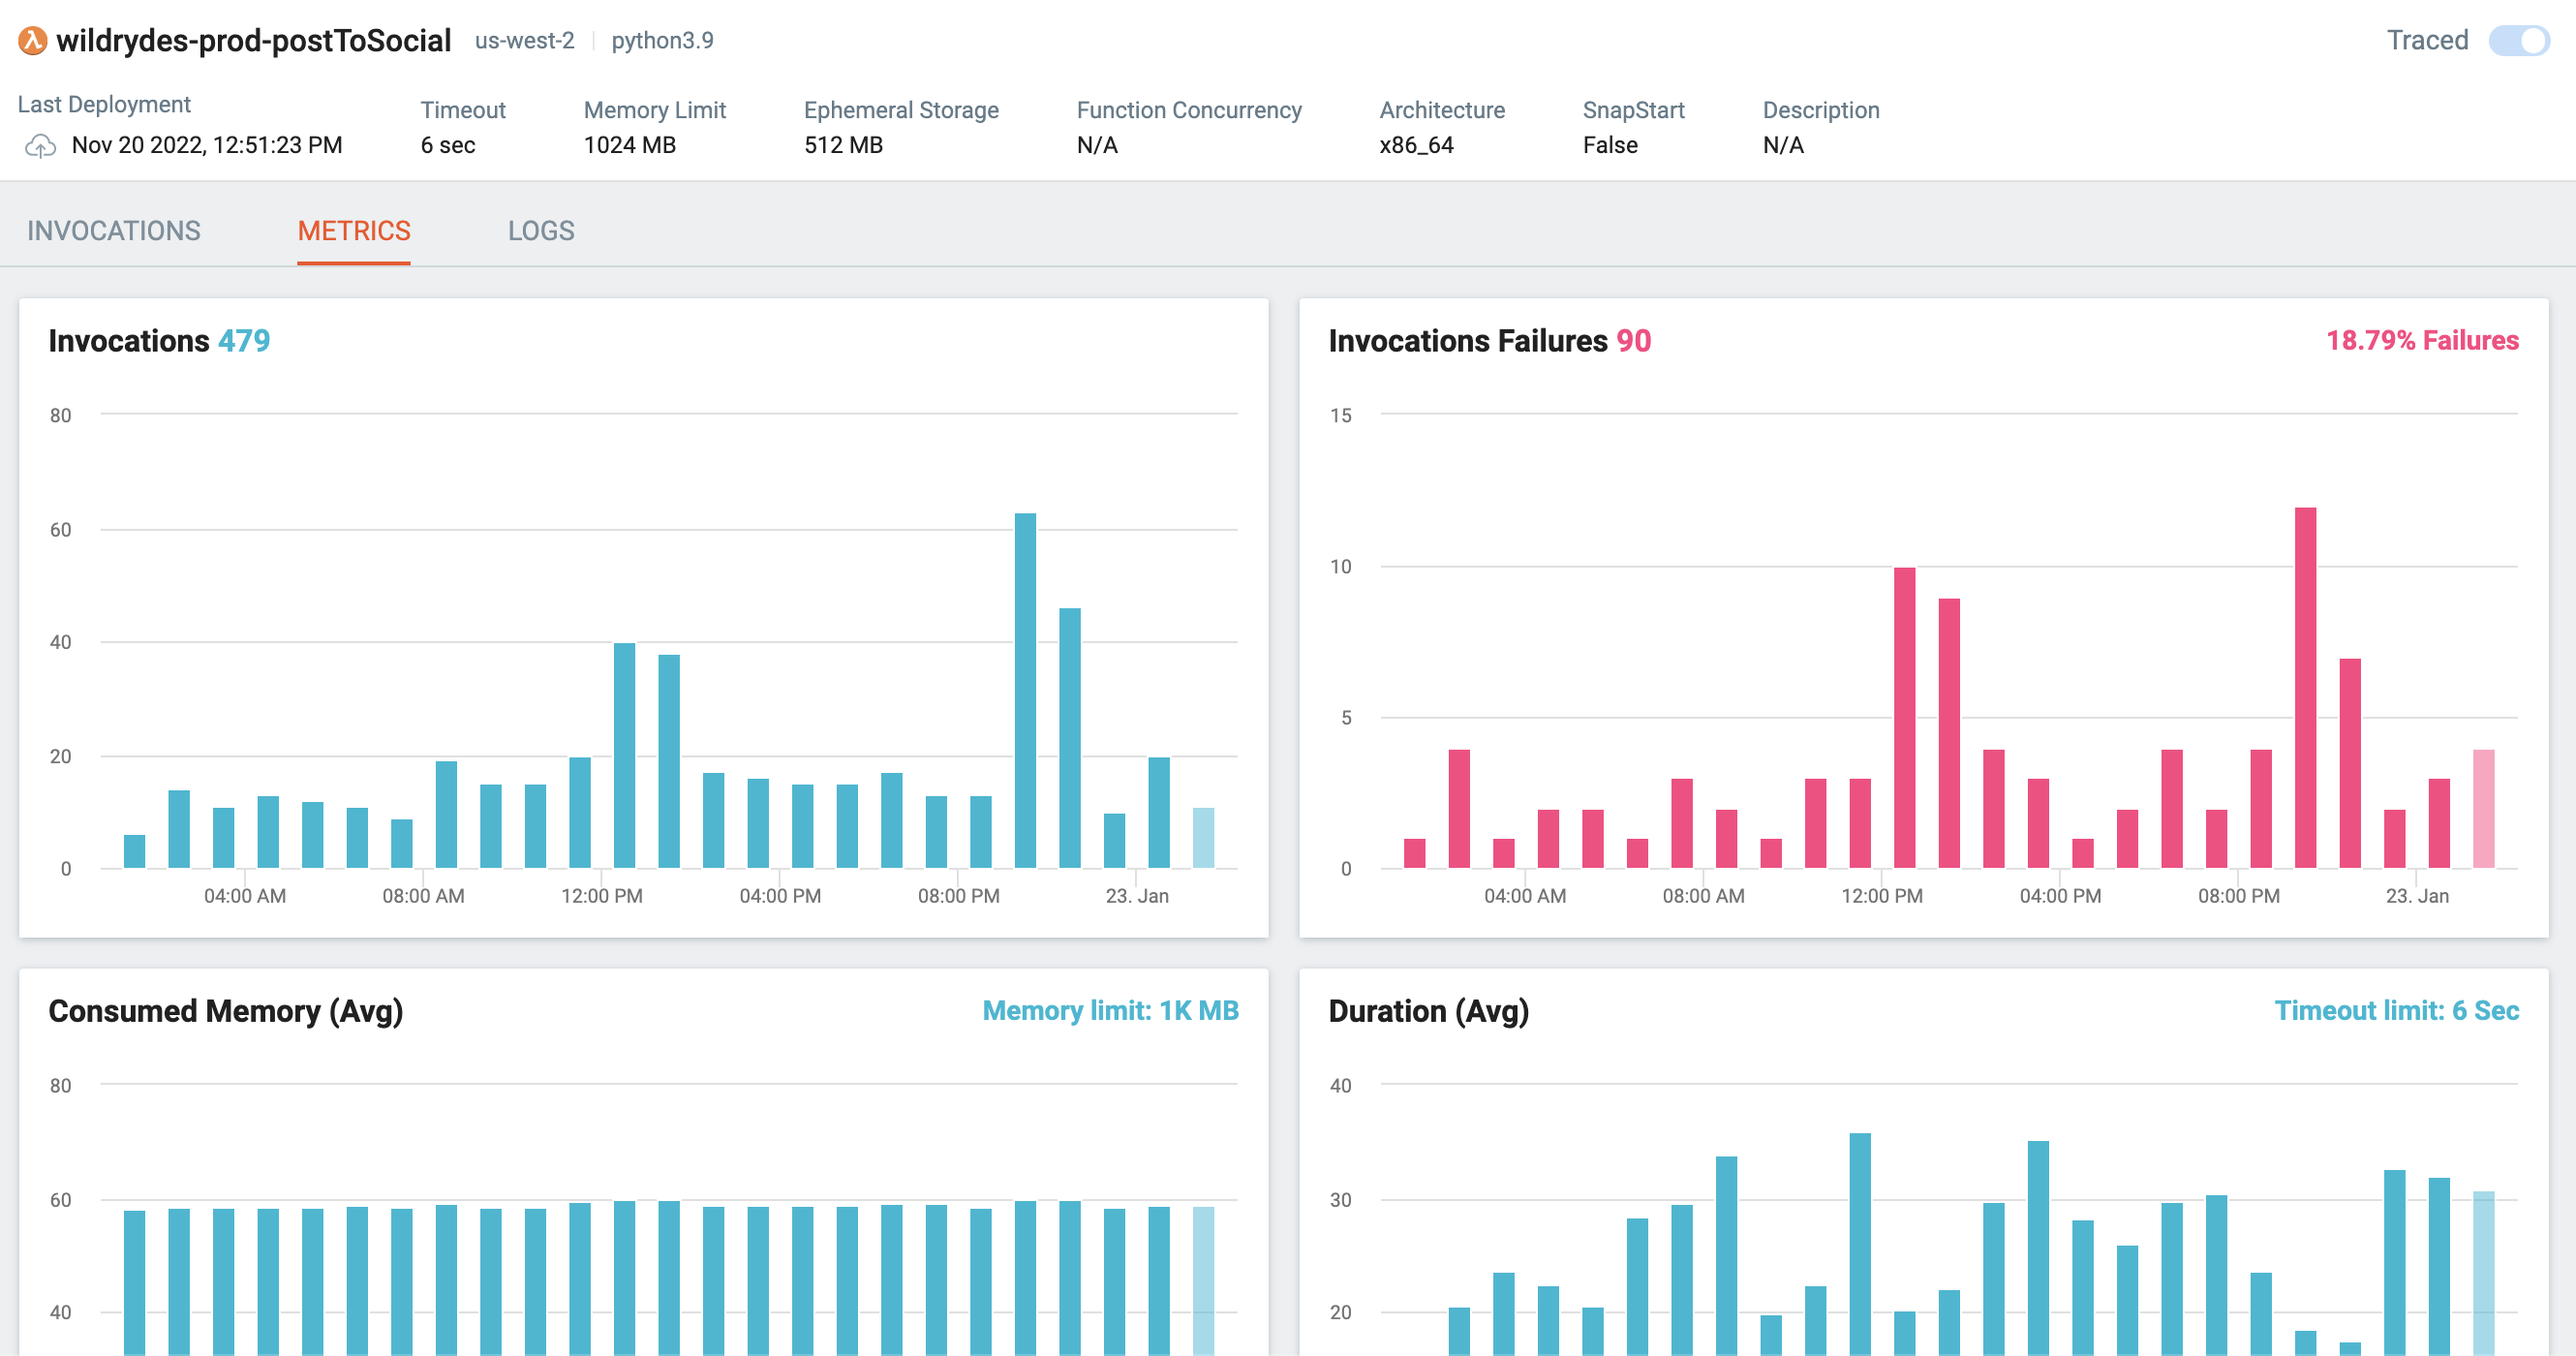
Metrics
The function metrics view allows you to view key performance metrics for the selected time frame, including:
Function Invocation
A chart comparing the number of invocations.
Invocation Failures
A chart comparing the number of invocation failures.
Consumed Memory (Average)
A chart comparing the average consumed memory.
Duration (Average)
A chart comparing the average duration of invocations.
Cold Starts
A chart comparing the number of cold start invocations.
Average Cold Starts Initial Duration
A chart comparing the average cold starts initial duration.
Function Cost
A chart comparing the cost of the AWS Lambda function.
Throttled Invocations
A chart comparing the number of throttled invocations.
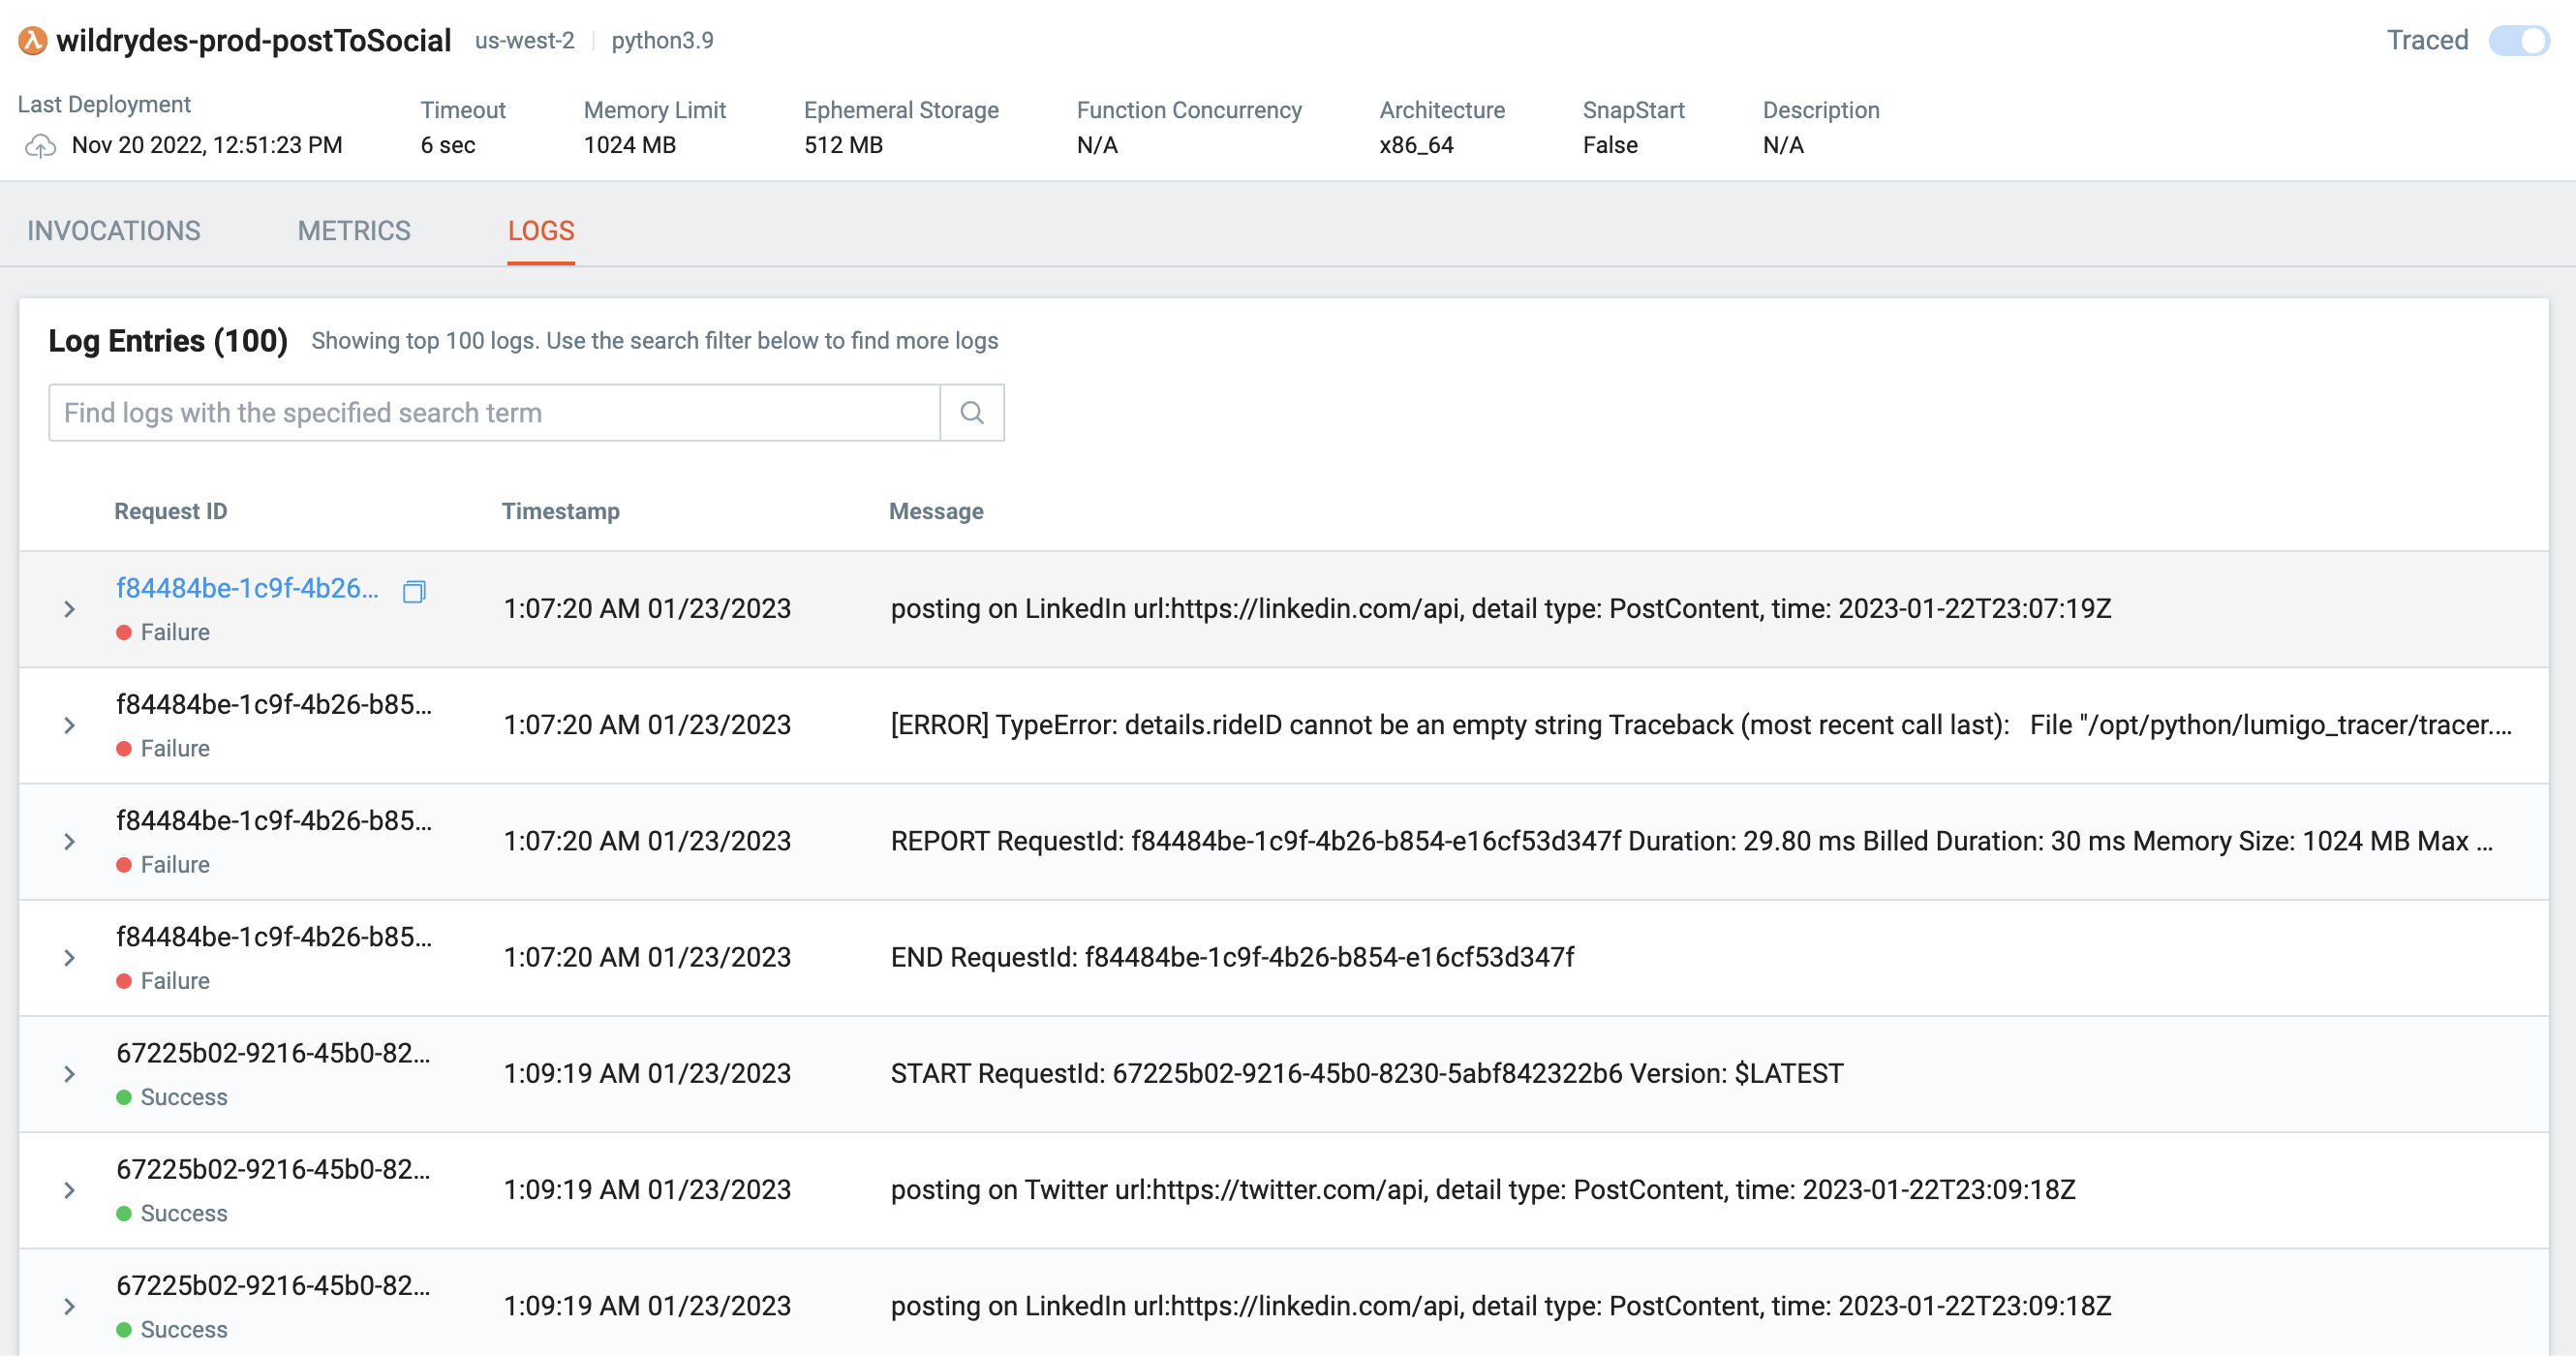
Logs
The function logs view allows you to search invocations whose log messages contain specific keywords with a plain text search.
Learn more
Function Deployments
Learn how changes in configuration or a new version of code causes an unexpected degraded performances.
Updated 11 months ago