Transaction View
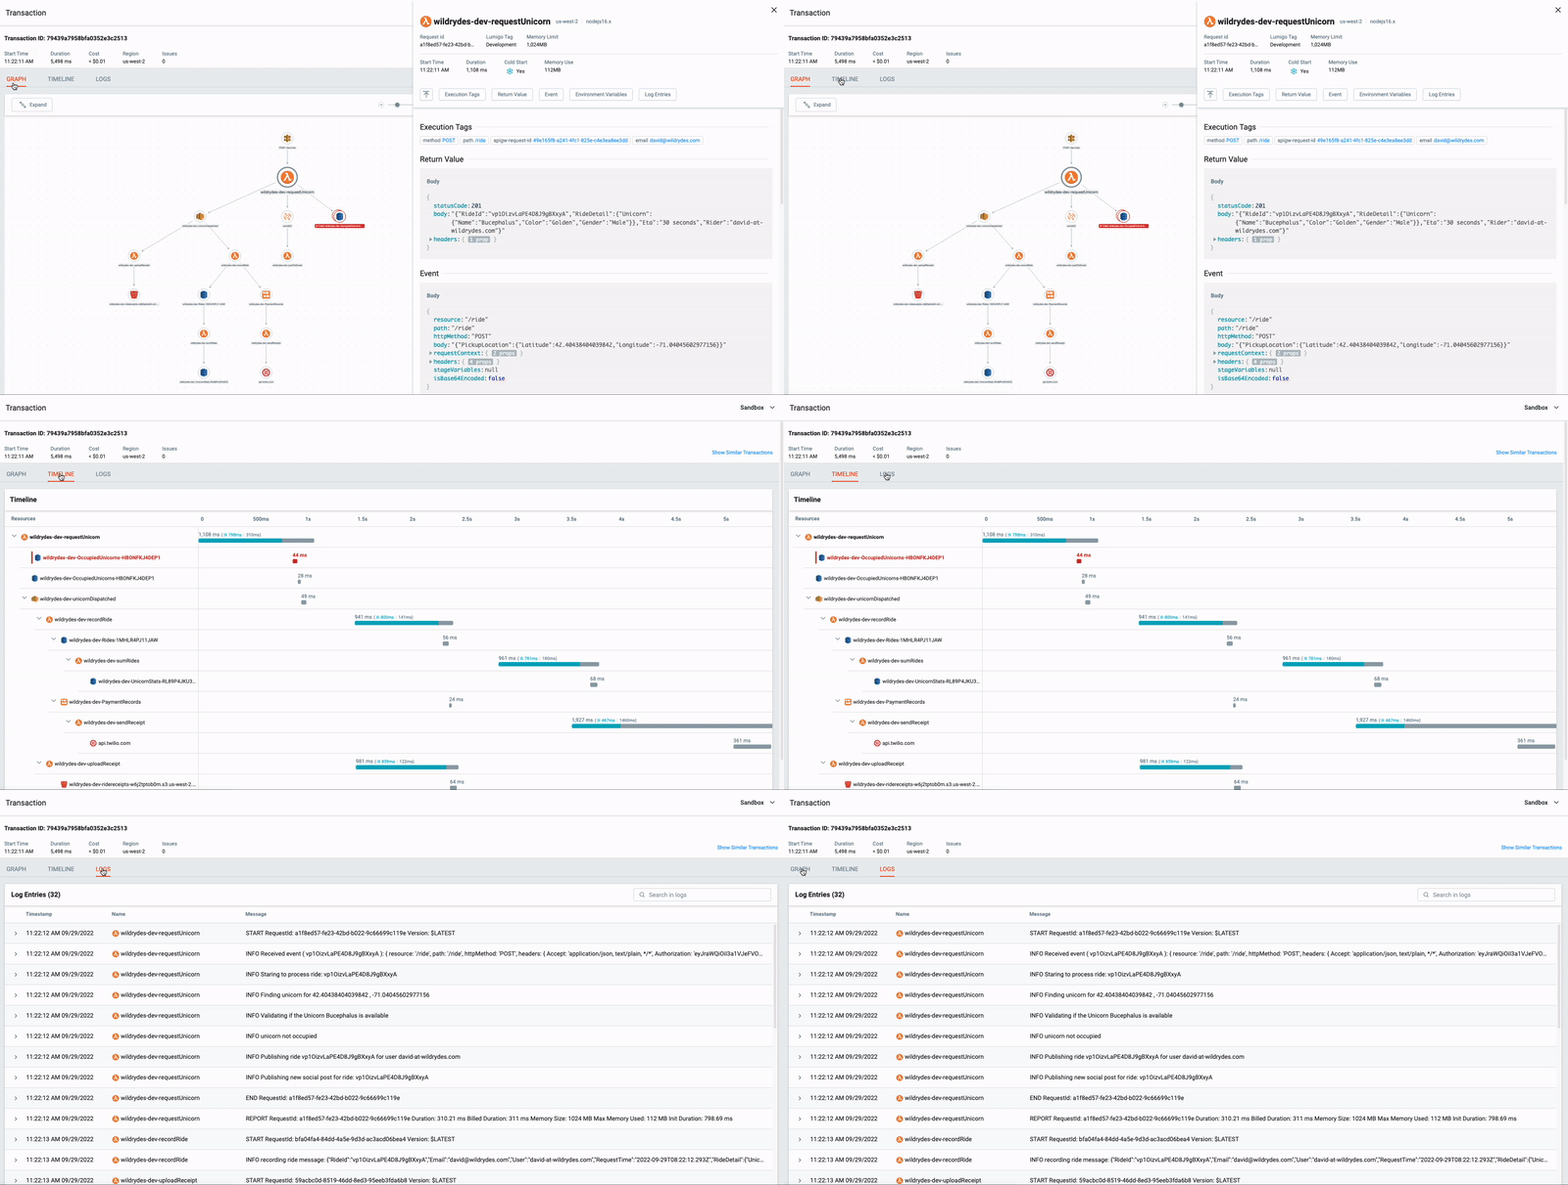
The Transaction View allows you to drill down into the details of requests as they propagate from one service to the next in your distributed application, troubleshoot errors, understand the service latencies, and identify performance bottlenecks.

For each transaction, the page displays:
- Mesh graph showing dependencies between services.
- Timeline flame graph showing service duration.
- List of log entries collected from your Lambda functions.
- Trace details view showing metadata and payload of every call.
By default, the Transaction View displays a split view of the transaction's graph and log entries. Clicking on the nodes will open the Trace Details view showing metadata and payload of every call
Transactions are uniquely identified by a 24-digit Transaction ID. If you want to go directly to a specific transaction, you can do so using our Transaction API: platform.lumigo.io/transactions/v2/YOUR_TRANSACTION_ID
Learn more
Transaction Graph
Observed dependencies between services and understand how data flows through your application.
Transaction Timeline
Explore performance bottlenecks, lengthy asynchronous calls, timeouts, and cold starts.
Transaction Logs
Review log entries collected from your applications that were part of the transaction.
Trace Details
Drill down into the stack trace, issues and the payload of requests and responses.
Updated 8 months ago