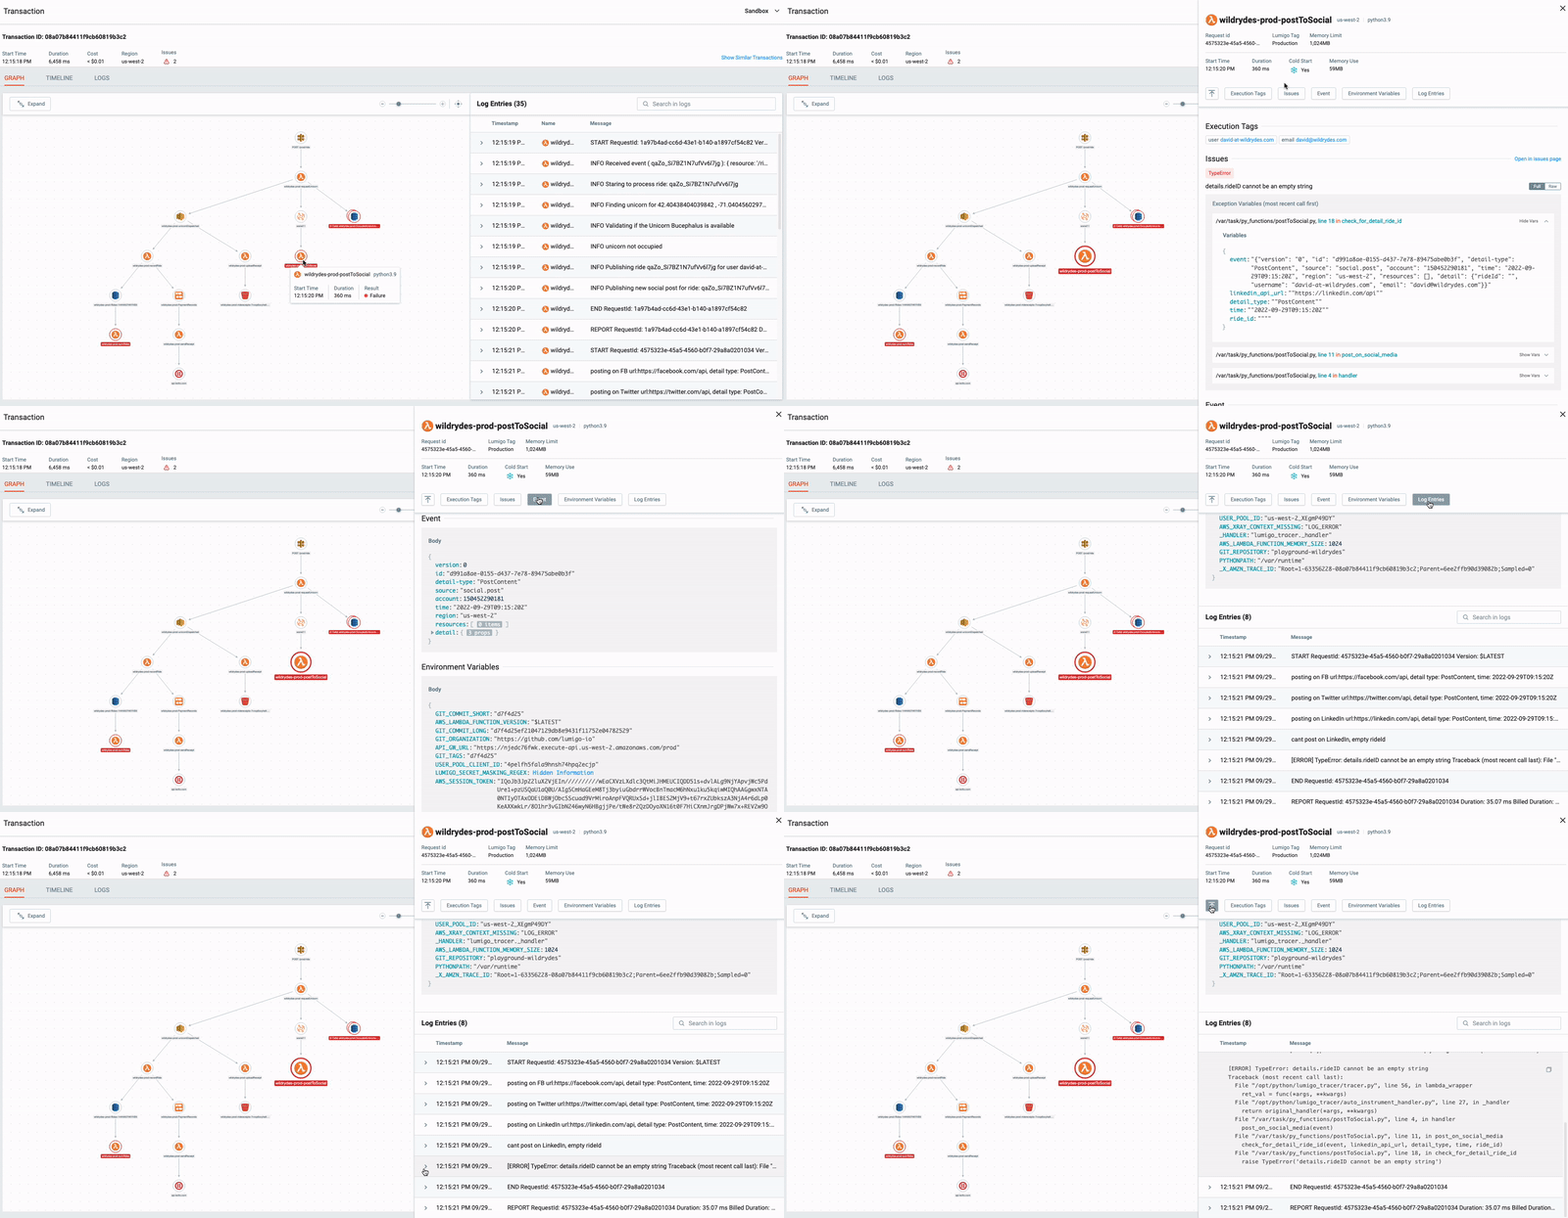
Trace Details
The Trace Details view allows you to drill down into the details and payload of requests as they propagate from one service to the next in your distributed application, identify errors, and performance bottlenecks without losing context from switching between tools.

For each resource, the page displays:
- Start time
- Duration
- HTTP method and status code
- Related issues
- Log entires, execution tags, environment variables, and the payload of the request and response
What does [REDACTED] mean?If you see the value [REDACTED], it means that secret masking was applied. To turn off this feature, please visit this page.
Learn more
Transaction Graph
Observed dependencies between services and understand how data flows through your application.
Transaction Timeline
Explore performance bottlenecks, lengthy asynchronous calls, timeouts, and cold starts.
Transaction Logs
Review log entries collected from your applications that were part of the transaction.
Updated 8 months ago