Issues
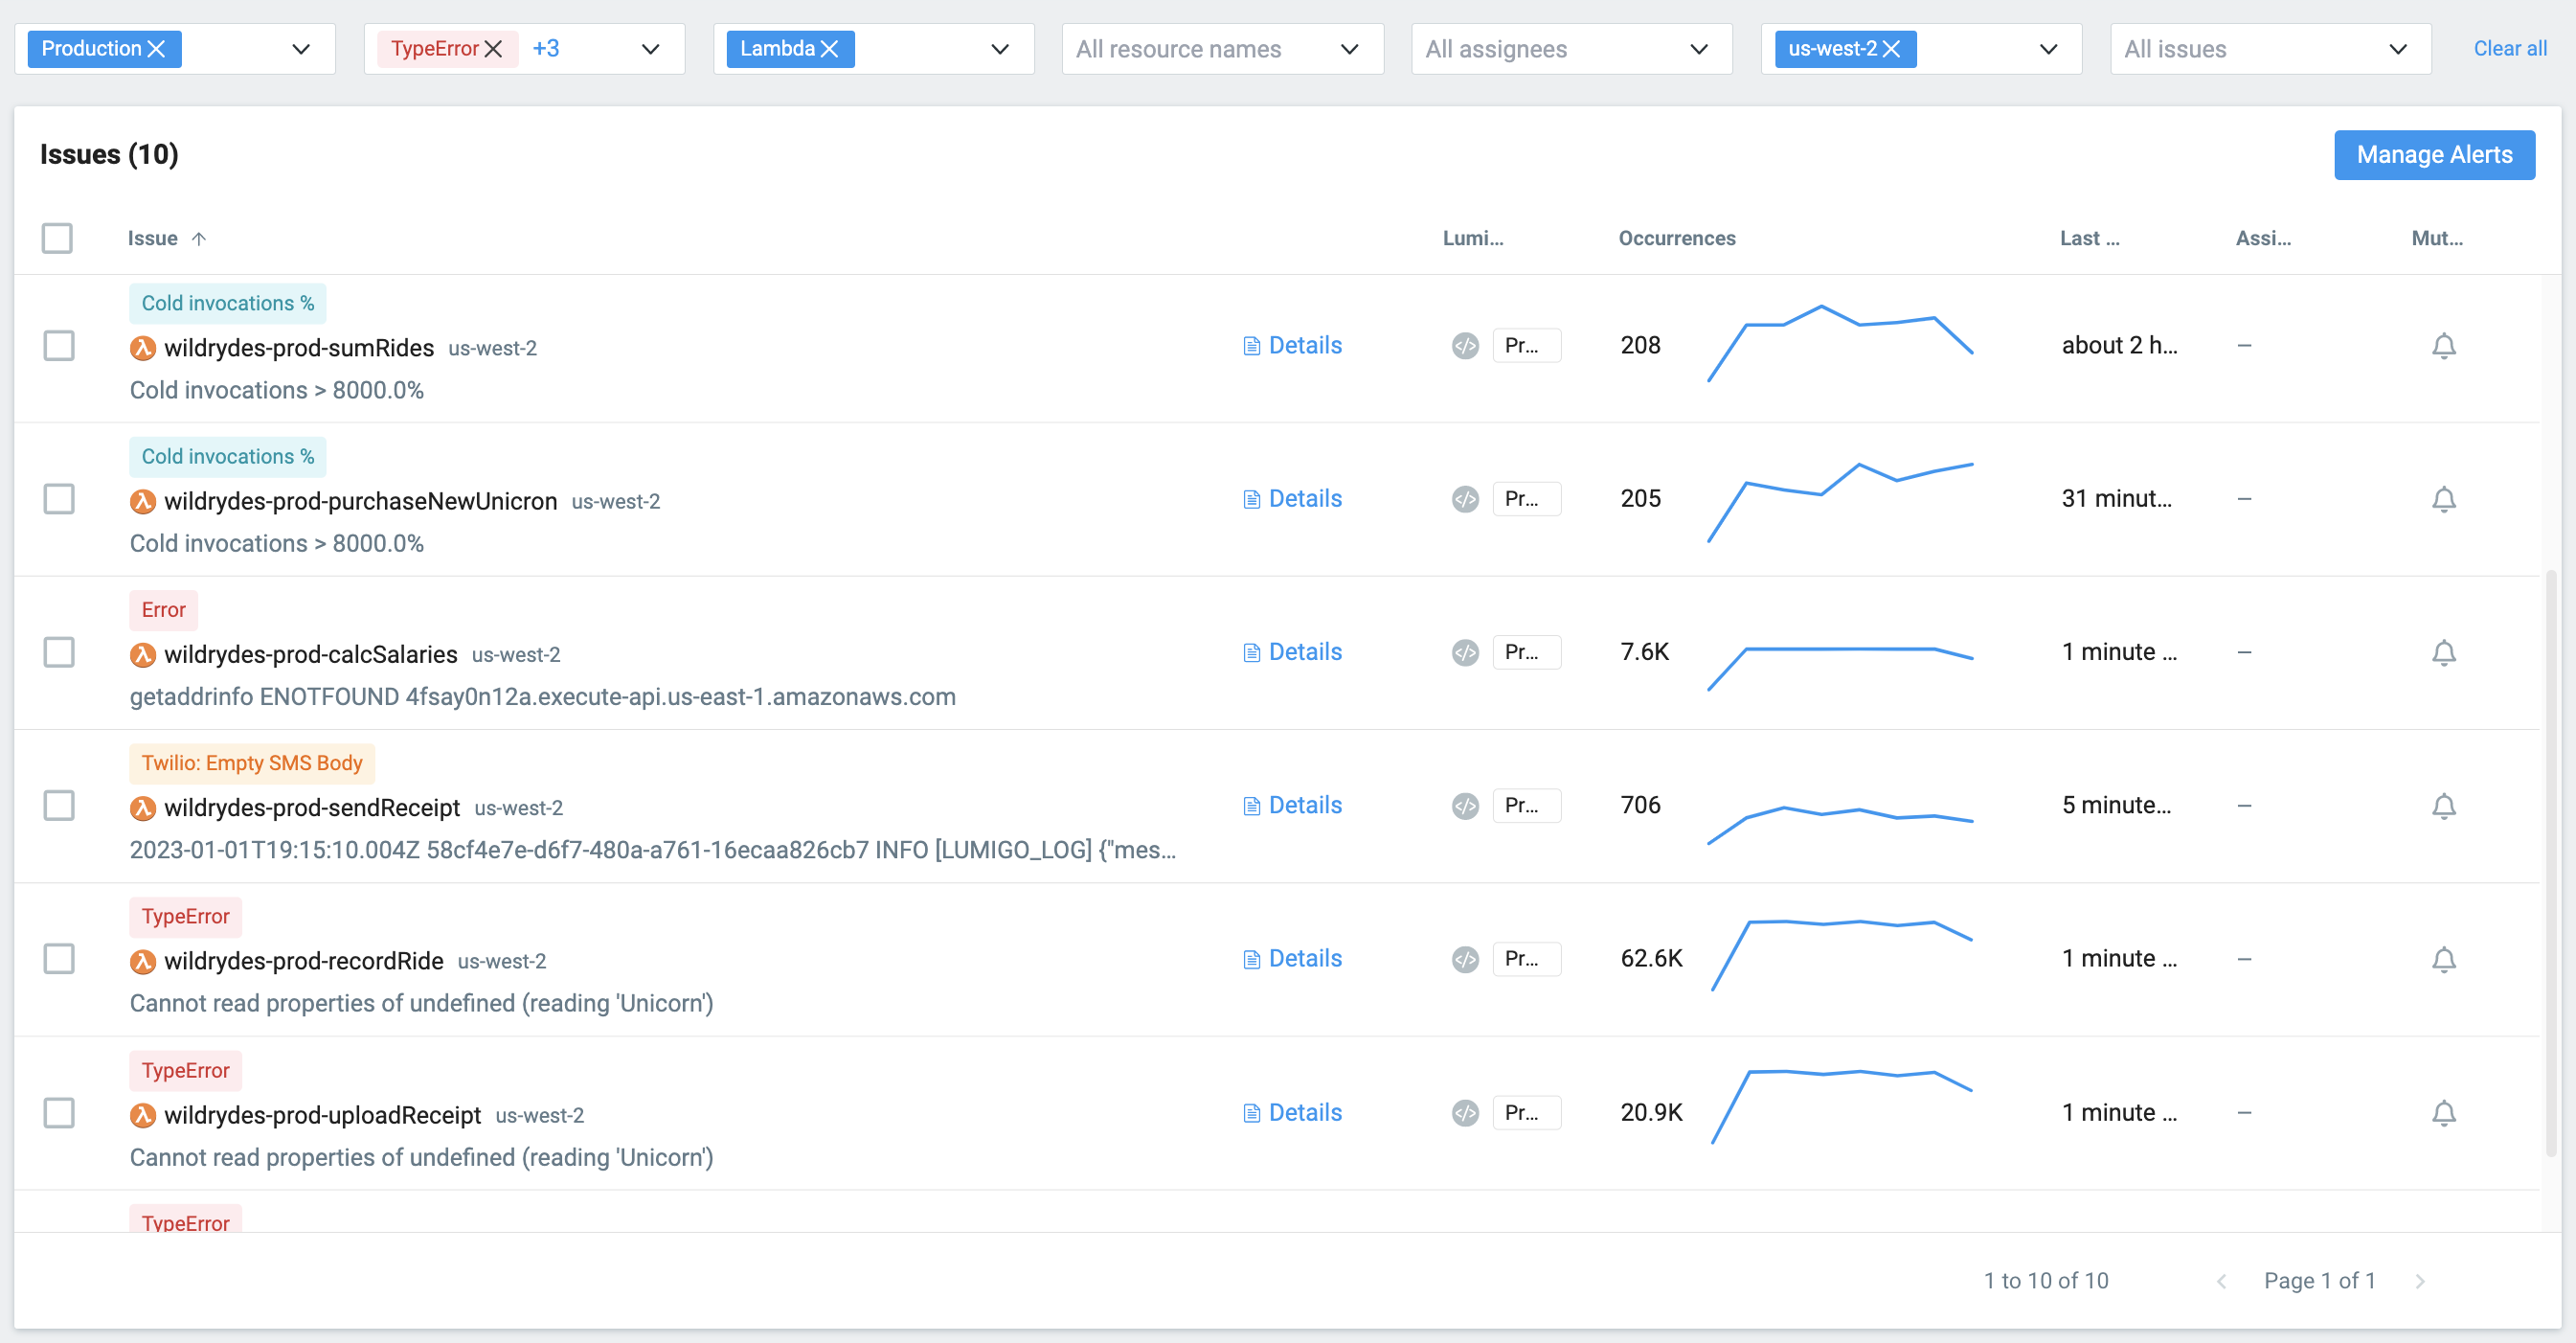
The Issues page displays information about errors, warnings, and performance problems in your application. It allows you to filter by properties such as service, resource, issue type, or assignee to review issues that require attention and possibly action. You can click on an issue to inspect it in detail to identify and troubleshoot the root cause.

You can think of an issue as a group of similar events that allows you to see how frequently they are happening and how they are affecting your application.
For each issue, the page displays:
- Issue type and description.
- Affected resource.
- Issue occurrences over the specified time range.
- Assignee.
- Alert notification status.
Issue Level
There are four levels of issues: errors, timeouts, warnings, and performance issues.
- Error indicates that a fatal error or code exception occurred.
- Timeout indicates that a timeout error occurred.
- Warning indicates that a non fatal error occurred, such as application error.
- Info indicated that a performance metric exceeded its predefined threshold.
Issue Details and Triage
Reviewing issues allows to identify and stay on top of the most important problems in your application. You can filter issues by properties, and take actions such as assigning, creating tickets, and muting alert notifications.
From the Issues page, you can start triage individual issues. Click on the issue to open the Issue Details View to see information related to the individual issue such as the stack trace and a distribution of associated execution tags.
You can also assign, mute, and create Jira tickets for multiple issues by selecting the respective check boxes.

Learn more
Issue Details View
Get insight into the issue's root cause, it's cascading effects, and the possible impact on your application and users.
Customize application errors
Customize application errors with programmatic log errors.
Enrich traces with Execution Tags
Dynamically add dimensions to your Lambda function invocations.
Updated 9 months ago