Metrics Overview
Overview
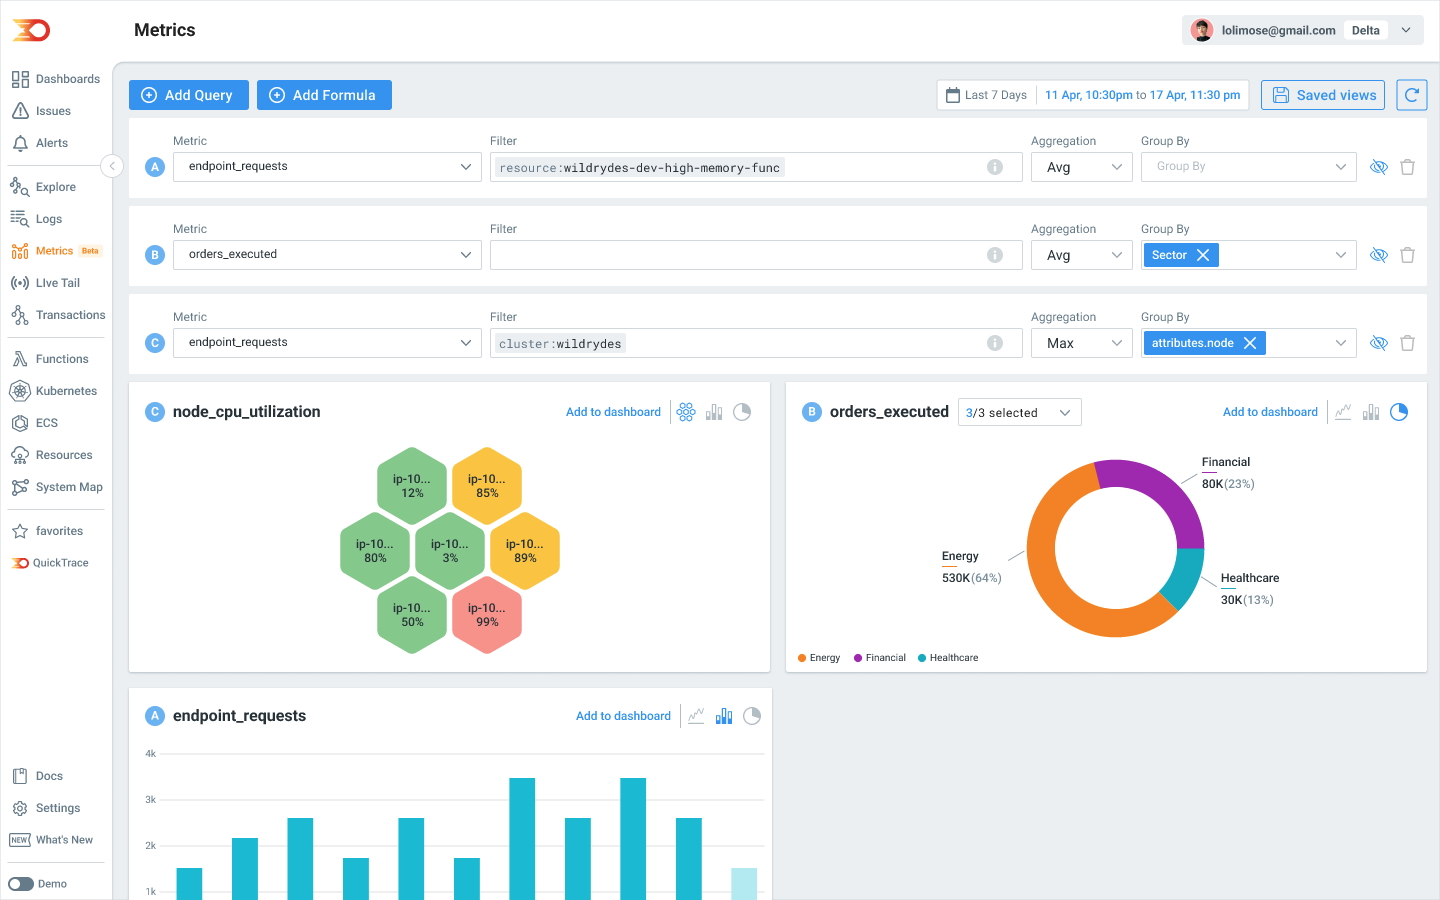
Lumigo provides a unified platform to monitor your application's and infrastructure performance. You can easily query metrics, track key metrics using dashboards, and monitor your applications and infrastructures using alerts.
Key features
- Kubernetes metrics - Visualize cluster health and identify resource constraints.
- Metrics with OpenTelemetry - Integrate your metrics with OpenTelemetry's solution.
- AWS CloudWatch metrics stream - Unify infrastructure and application monitoring.
- Prometheus metrics - Prometheus scrapes metrics from any suitable and compliant source. This can be Kubernetes pods, ECS, simple containers and more, so long as it exposes an endpoint in a format that can be scraped. After metrics are collected by Prometheus, you can export them to the Lumigo backend by using OpenTelemetry's metrics format.