Dashboards
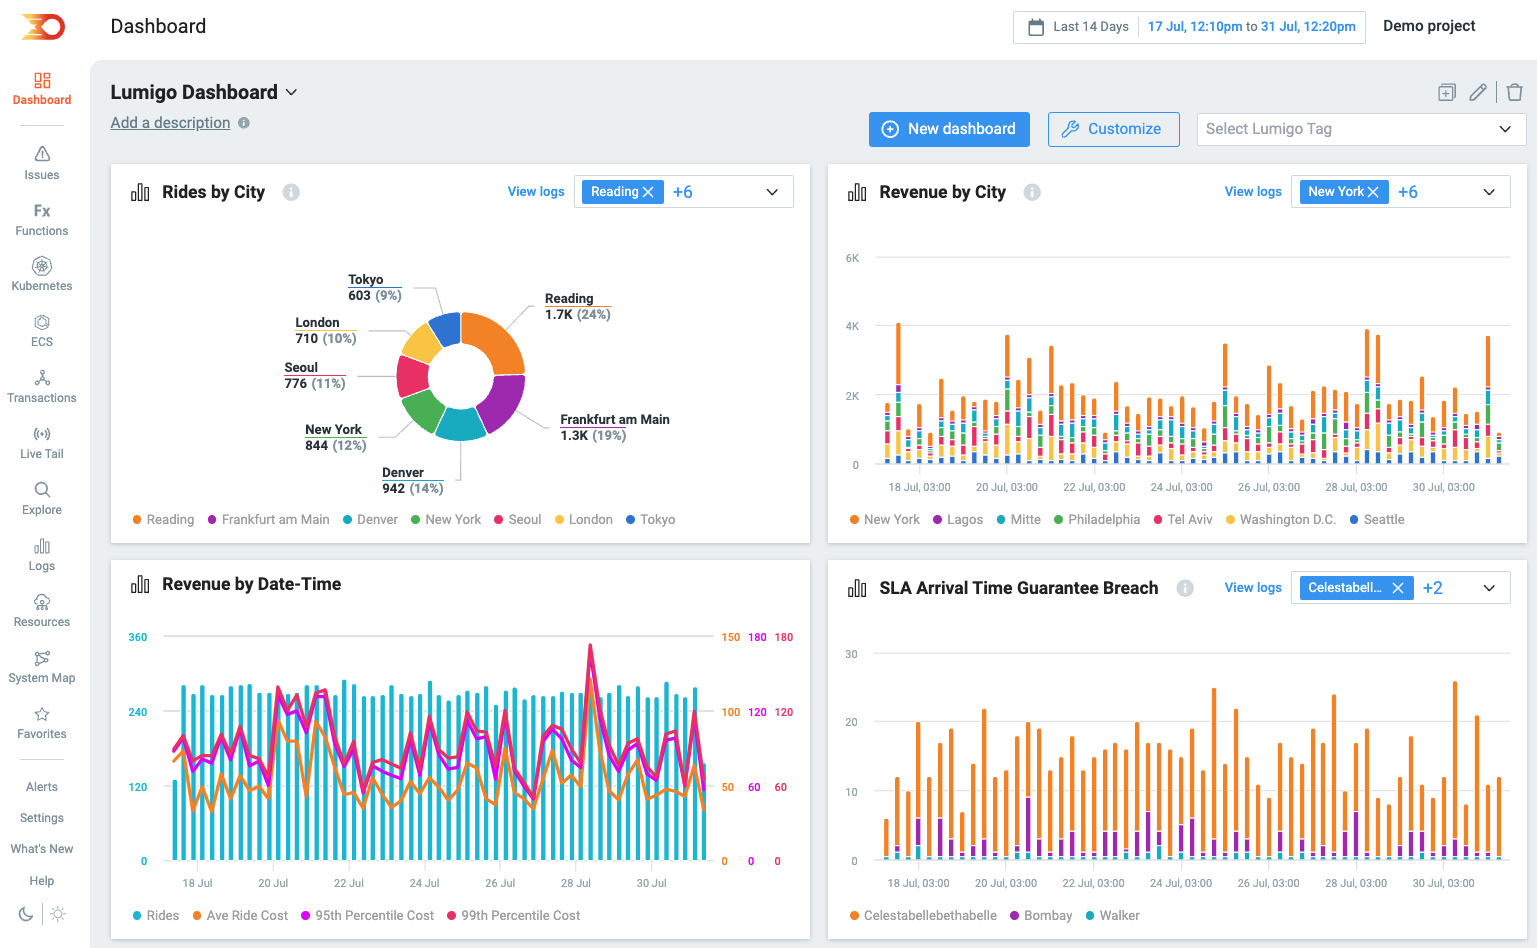
The Dashboards page serves as your main view for monitoring system health by allowing you to navigate through key metrics across your project. You can create multiple dashboards to serve the needs of several teams or to reflect different areas of your environment.
All dashboard widgets reflects the date and time range indicated in time selector. To narrow your scope, use the Lumigo Tag filter or zoom in on any time series metric, and all widgets will synchronously update as you do so.
Customization
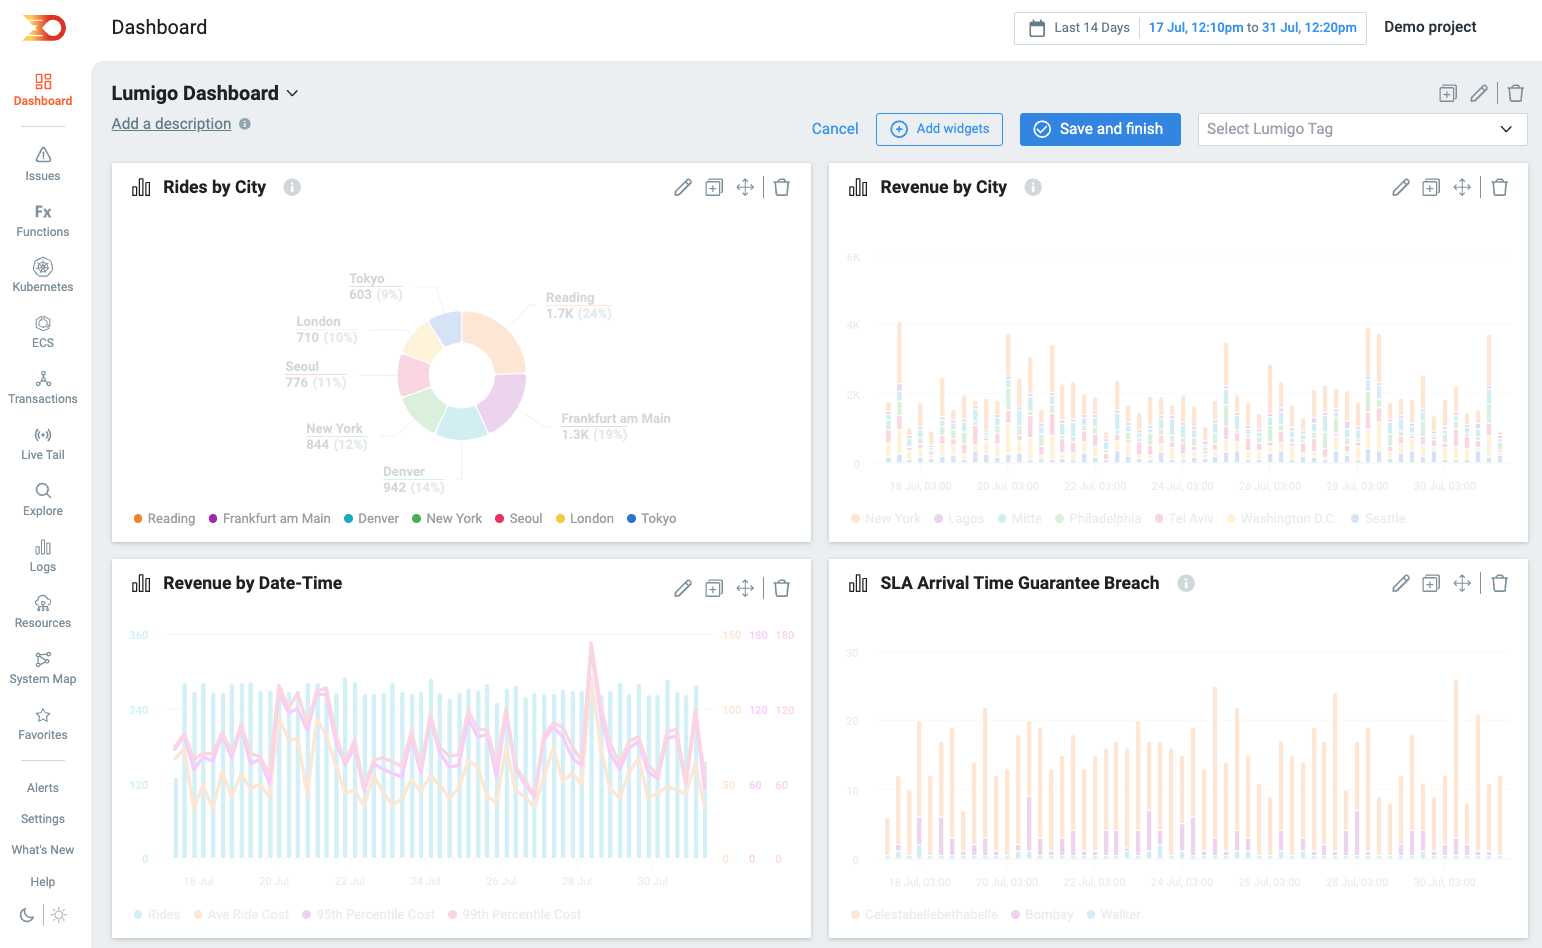
Proceed with cautionAny changes you make will affect all users in the project. You cannot undo changes.
To customize a dashboard, click Customize, and edit mode will be enabled. In edit mode, you can rearrange, resize, add, or remove widgets. To save your changes, click on Save and Finish.
Permissions
All users in a projects have complete permissions to all of the project's dashboards.