Jump to Content
Lumigo Docs
HomeDocumentation
Log InLumigo Docs
Log In

Quickstart

  • Create an Account
  • Connect Your Environment
  • Set Up Alerts
  • Invite Team Members

Tracing

  • Auto-Tracing
  • Manual Tracing
    • Python
    • Node.js
    • JVM
    • .NET
    • Go
  • Serverless Framework

Application Guide

  • Dashboard
    • Dynamic Dashboard
  • Issues
  • Functions
    • Function View
    • Deployment Points
  • Live-Tail
  • API Gateway
  • Transactions
    • Transaction View
    • Graph
    • Timeline
    • Logs
    • Trace Details
  • System Map
  • Explore
  • Alerts
  • Settings
    • Integrations
    • Monitoring & Tracing
    • AWS Account
    • User Management

Integrations

  • Slack
  • PagerDuty
  • Microsoft Teams
  • VictorOps
  • OpsGenie
  • Jira
  • GitHub
  • GitLab
  • Bitbucket
  • Stackery
  • Serverless Stack

Advanced Configurations

  • Step Functions
  • Execution Tags
  • Programmatic Errors
  • Secret Masking
  • Domain Scrubbing
  • Lambda Aliases
  • Lambda Extensions
  • AppSync Logs
  • VPC
  • [email protected] Tracing

Best Practices

  • Log Streaming
  • Execution Leak
  • Lambda Layers
  • Frontend to Backend Tracing

General

  • FAQ
  • Security & Privacy
  • Support
  • Service Health
Powered by 

API Gateway

Suggest Edits

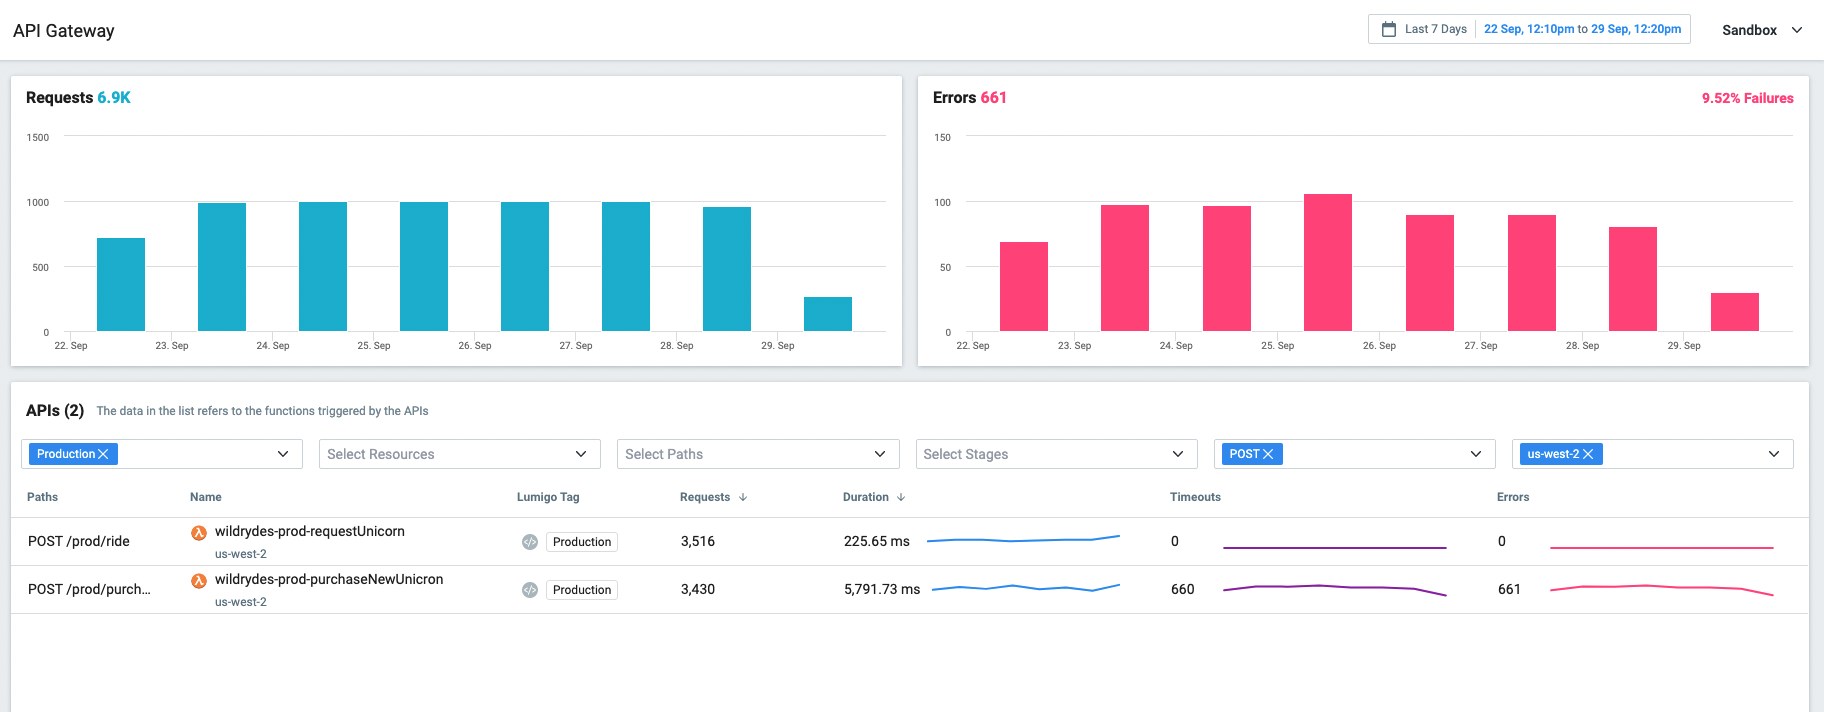
A number of key metrics are provided on the Lumigo API Gateway page to help you monitor and debug lambdas triggered by HTTP.

The following information is available for every API:

  • Path
  • The function triggered by the API
  • Number of requests
  • Duration
  • Timeouts
  • Number of errors

Updated 3 months ago


Did this page help you?