Metric Alert
Metric alerts are triggered when a metric exceeds a specific threshold for a specified period of time. Metrics represent a time-ordered set of data points. Un other words, you can think of a metric as a variable to
monitor, and the data points as representing the values of that variable over time. An example is to set an alert triggered when a Lambda function's error rate increases by 10% or more over the last 10 minutes.
The alert type is displayed below the alert name on the Alerts page.

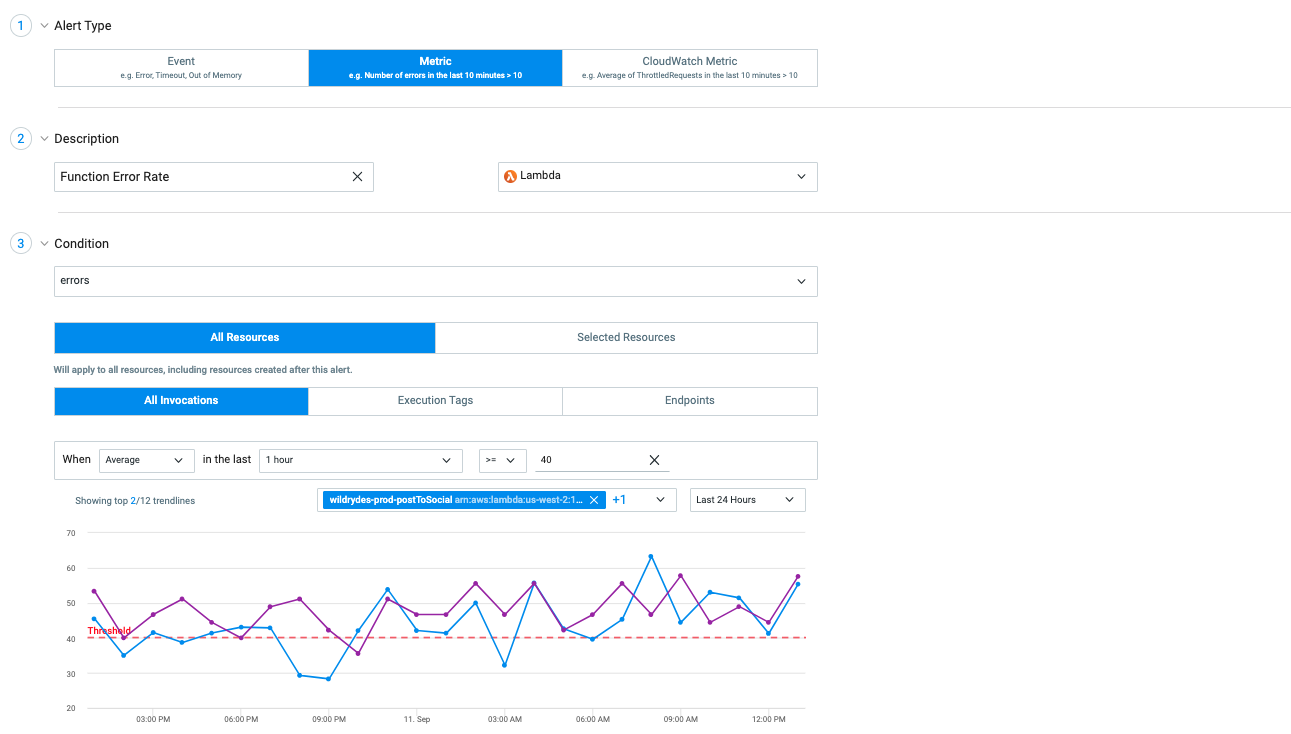
Create a metric alert
- Navigate to Alerts and select Create New Alert.
- Select Metric as the type of alert.
- Name the alert in the Description field and select the service to which the alert applies.
- Select the resources to which the alert applies.
- Specify the Condition that will trigger the alert.
- Select Save.
Apply resources to alerts
There are several way to apply resources to an alert:
All Resources
Applies to all current resources; resources created after this alert is set are added automatically.
Selected Resources
Applies to the selected resources; resources created after this alert is set may be added manually.
All Requests or Invocations
Applies to all requests or invocations of the selected resources.
Selected Requests or Invocations
Applies to all requests or invocations with selected Execution tags, or Endpoints; requests and invocations tagged with selected tags after this alert is set are added automatically.
Supported Metrics
| Metric | Service | Description |
|---|---|---|
| Invocations | Lambda | The number of invocations in a given period, including successful invocations and invocations that result in a function error.
|
| Requests | ECS, Kubernetes | The number of requests in a given period, irrespectively of whether the request is successful or not.
|
| Errors | Lambda, ECS, Kubernetes | The number of invocations or requests that result in an error. By default, errors do not include Programmatic Errors.
|
| Duration | Lambda, ECS, Kubernetes | The amount of time spent processing a request.
|
| Cold Start | Lambda | The number of cold start invocations of a function.
|
| Memory Used | Lambda | The amount of memory that your function consumes when processing an event.
|
Learn more
Create Event Alert
Learn how to create alerts that keep you informed about errors and exceptions.
Create CloudWatch Metric Alert
Learn how to create alerts that keep you informed about AWS services.
Notifications
Learn about the types of notifications and how to manage them.
Updated 11 months ago