Explore
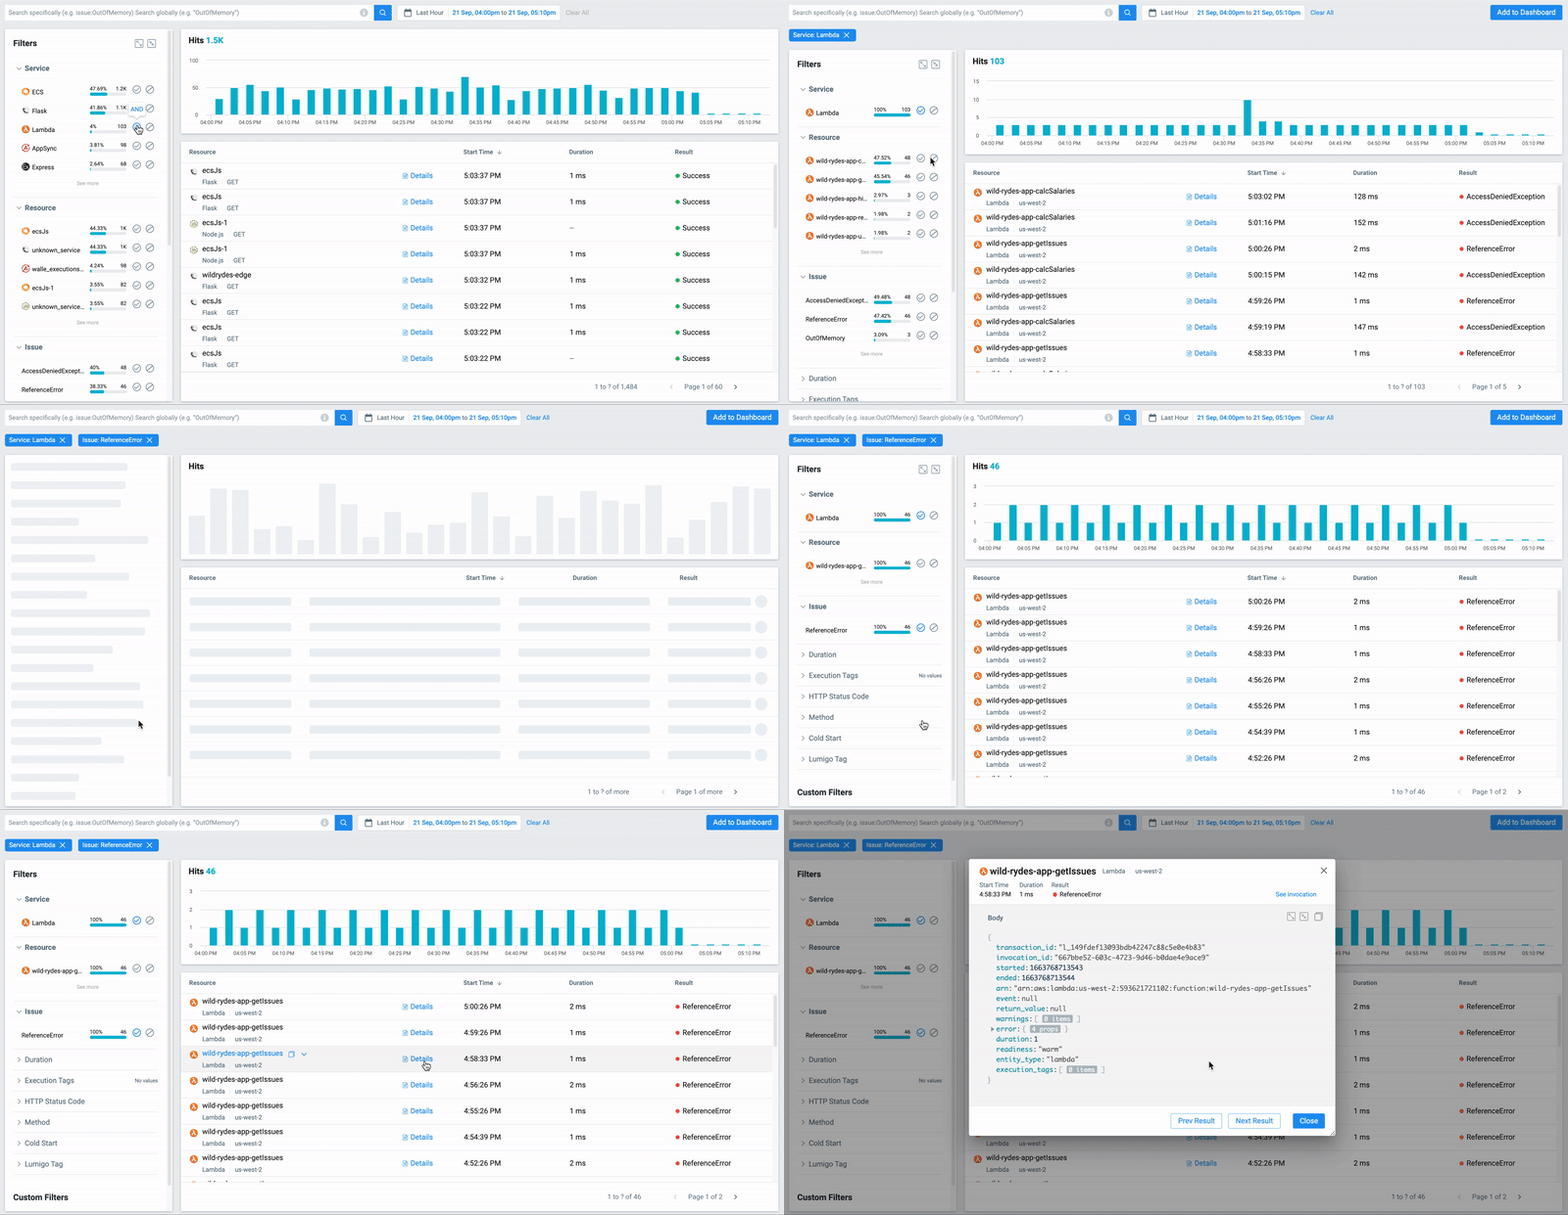
Lumigo Explore is the go-to feature when looking to uncover insights or query events across your serverless application. Explore is the ideal place to quickly get answers to critical questions and discover areas you’ve previously never tapped.
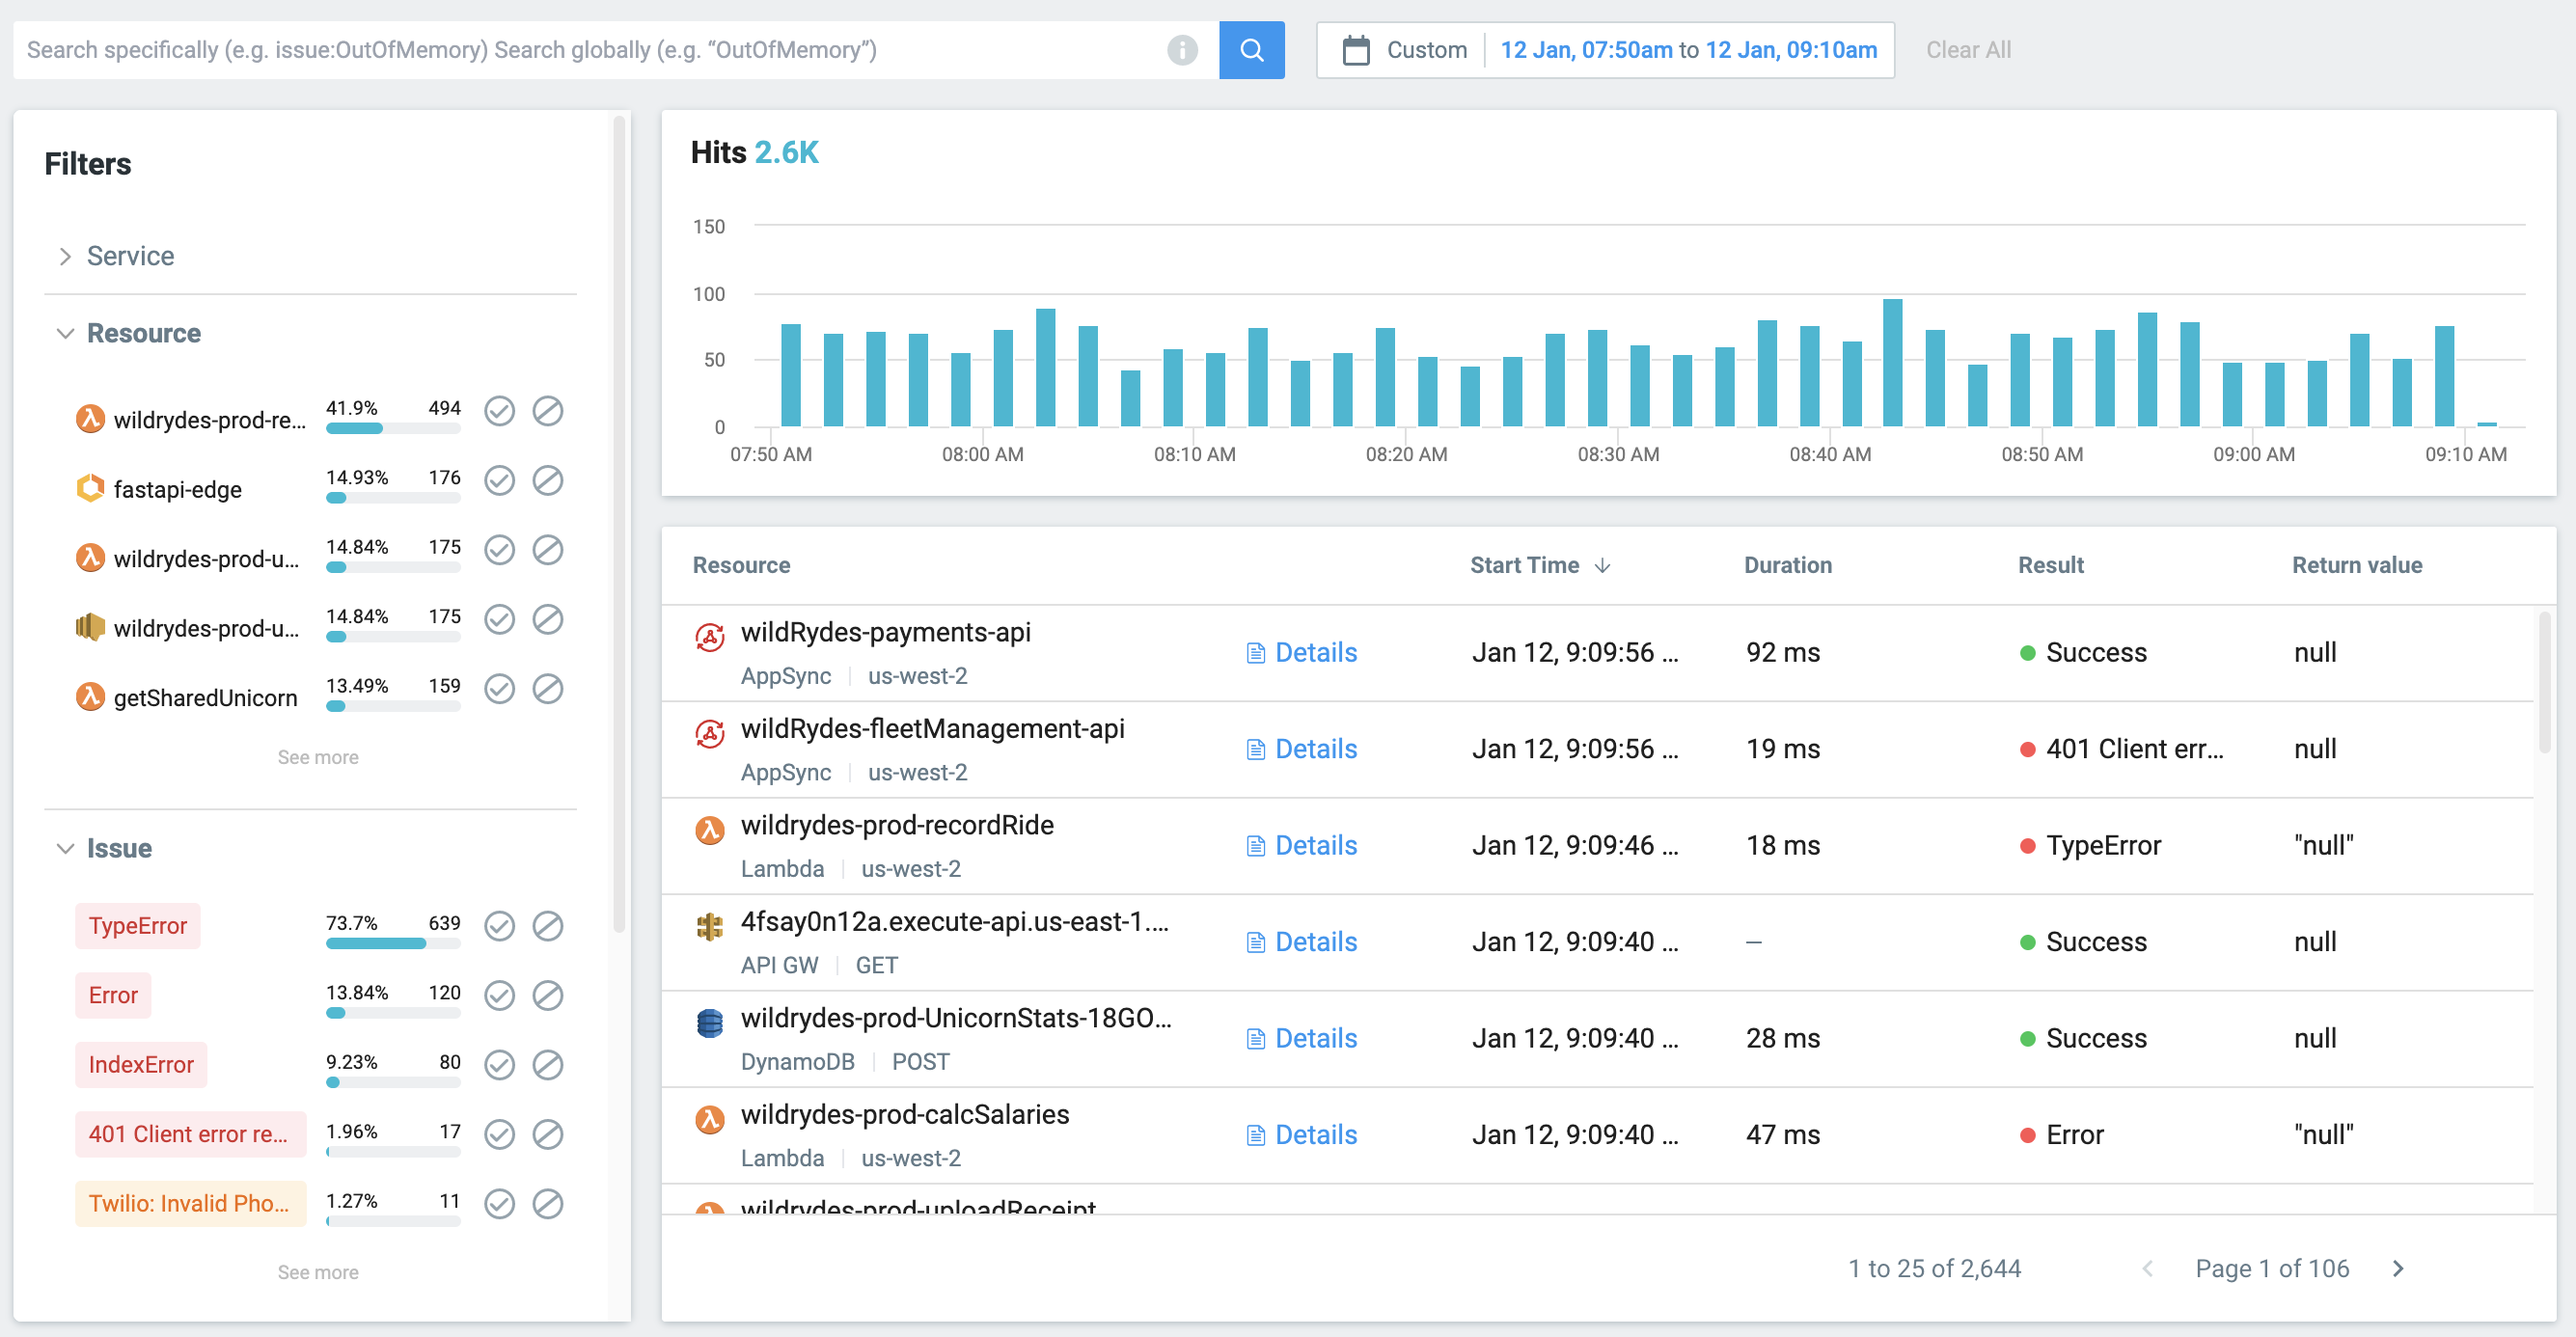
Use Explore to filter invocations, search for invocations that contain specific strings or that express certain properties, and to create custom metrics widgets.


Filters
Explore filters are the most effective and easiest method for querying invocations. Explore filters provide guidance that is specific to your data and offer a convenient way to compare trends over time and prioritize issues across your applications.
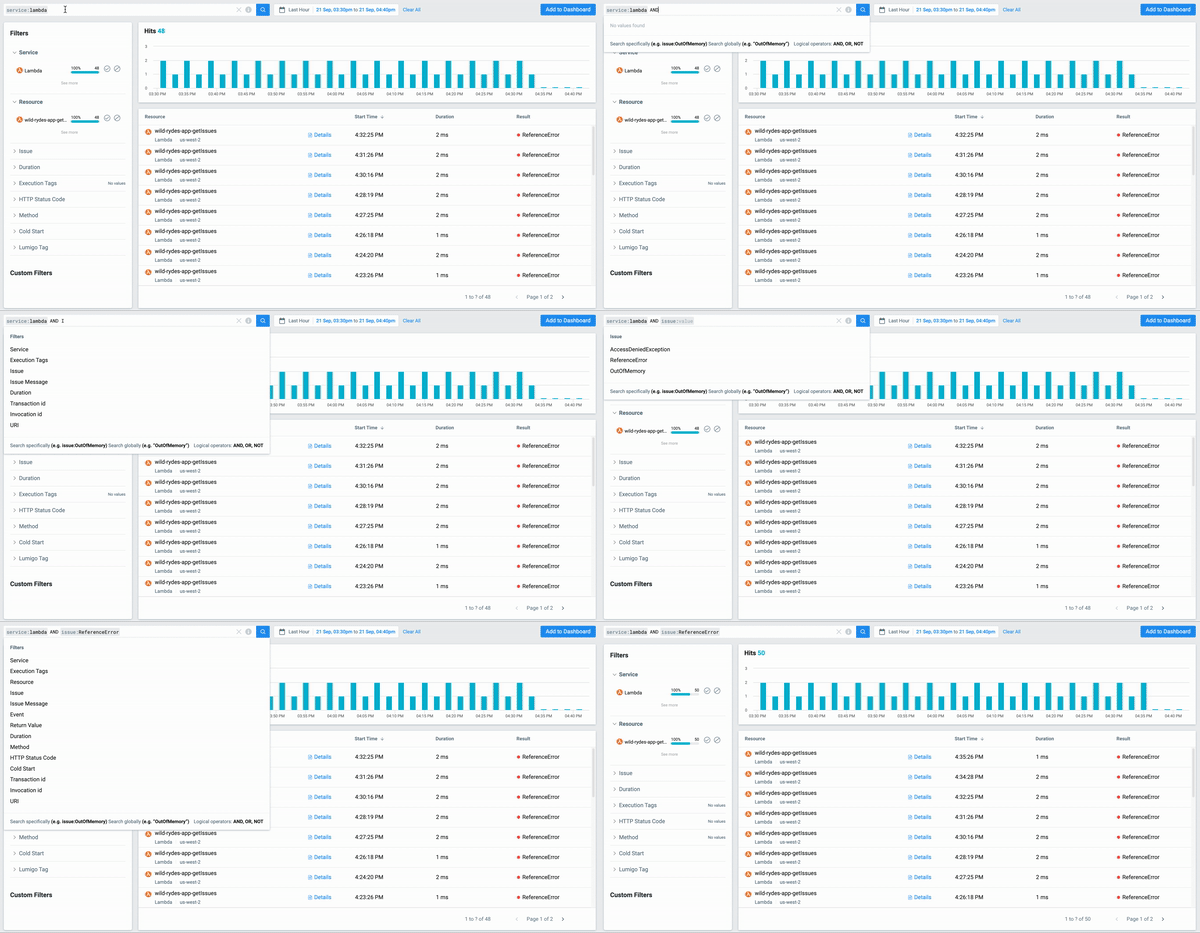
Search bar
You can search with free text in any field that Lumigo collects (see below) by typing the field name followed by a colon “:” and then the string you are looking for, or order a string surrounded by quotes “” to look for invocations that contain specific strings.
You can also use Explore predefined queries as a starting point or create more complex queries by using logical operators AND, OR, and parentheses for priority () to better define the search conditions.
Data fields
Lumigo collects the following data fields for each invocation:
- event: the event that the Lambda function receives
- return_value: the data that the Lambda function returns
- transaction_id: the unique id for a specific transaction
- started: the start time of the invocation (in unix format)
- ended: the end time of the invocation (in unix format)
- arn: the Lambda function's ARN
- region: the execution AWS region (e.g, us-west-1)
- runtime: the Lambda execution runtime (e.g, python3.7)
- duration: the duration of the Lambda function's execution
- resource_name: the name of the resource (e.g, Lambda name)
- readiness: cold or warm lambda invocations
- error: invocations with Timeout or use * for any error
- method: invocation with a specific method (POST, GET, PUT, PATCH, DELETE)
- host: specific hostname (kms.us-west-2.amazonaws.com)
- status_code: invocation with specific return status code
- key: invocations with a specific execution tag key
- value: invocations with a specific execution tag value
Query Syntax
These sample queries demonstrate the power and flexibility of our query language
Purpose | Format | Example Query |
---|---|---|
searching for a string | string | John Doe |
searching a specific attribute | : value | region: us-east-1 |
duration | [ TO ] | duration: [1000 TO *] |
multiple conditions (intersection) | AND | John Doe AND duration: >1000 |
priority | (condition) | region: us-west-1 AND (duration: >500 OR error: Timeout) |
Additional fields
There are additional fields we may collect, depending on which service and triggers you are using. Contact us with any questions about the additional fields we collect.
Create custom dashboard widgets
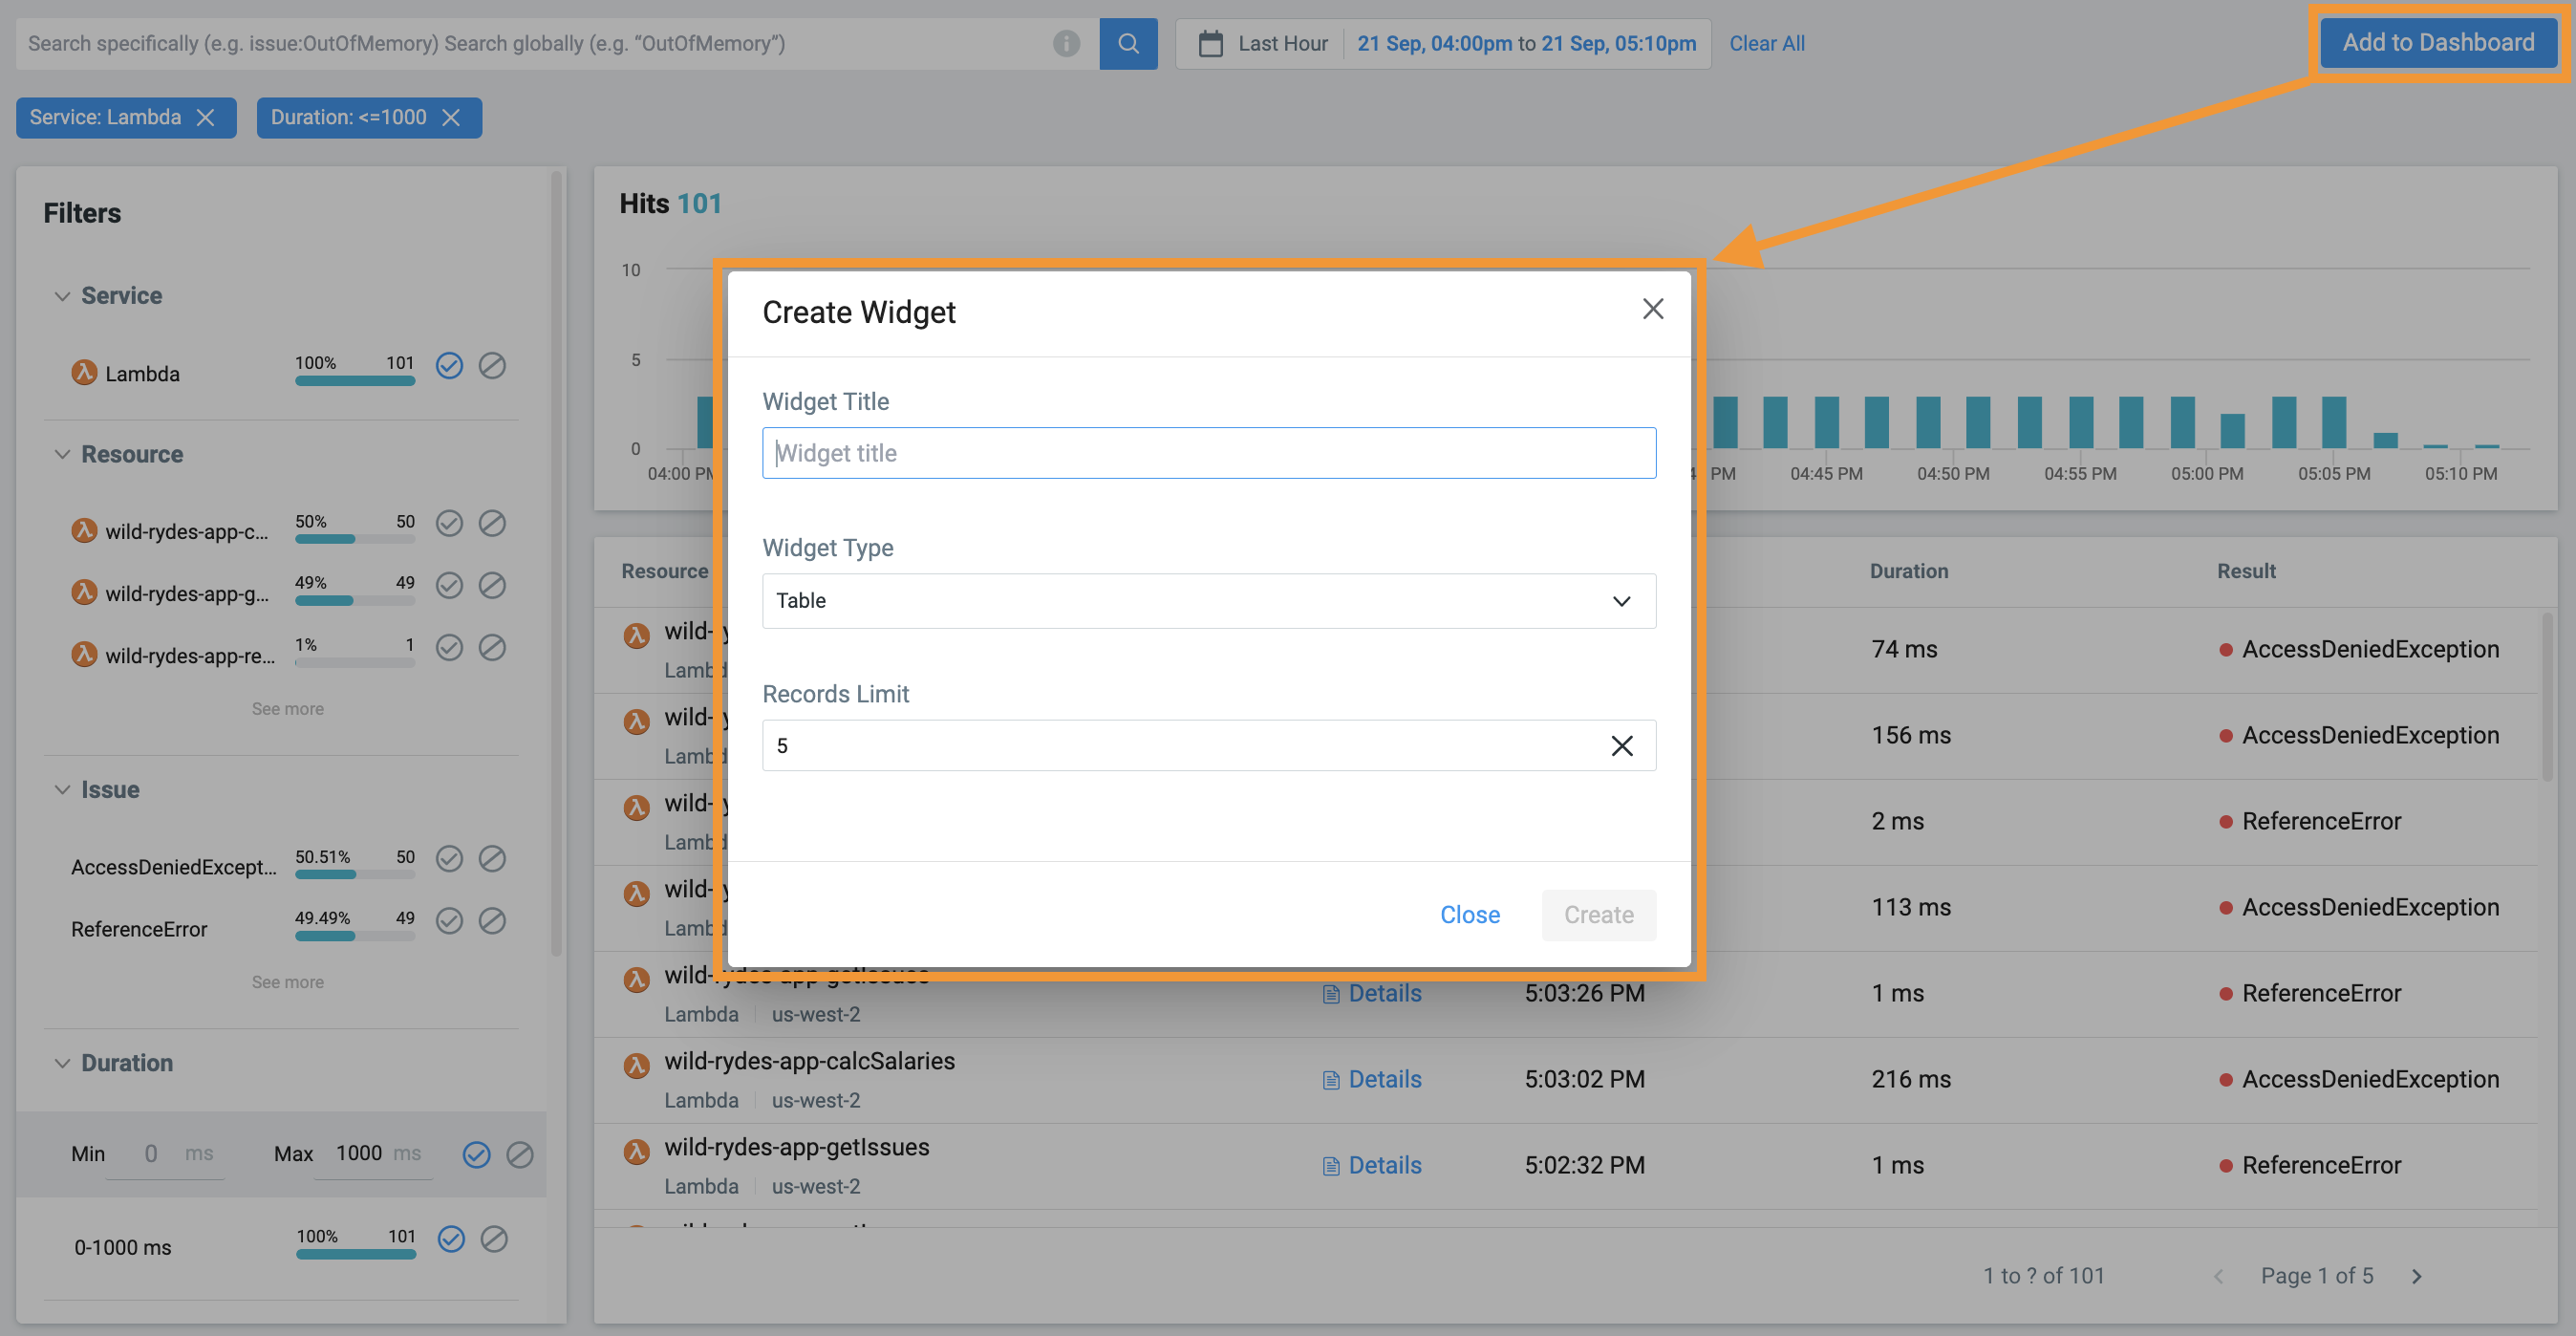
With Dynamic Dashboard you can easily create dashboard widgets from your Explore queries, to quickly track important metrics and scenarios.
To add a custom dashboard widget, after you've run your query simply:
- Click on Add to Dashboard.
- Choose your dashboard properties.
- Click on Create.

Updated 6 months ago