Explore Transactions
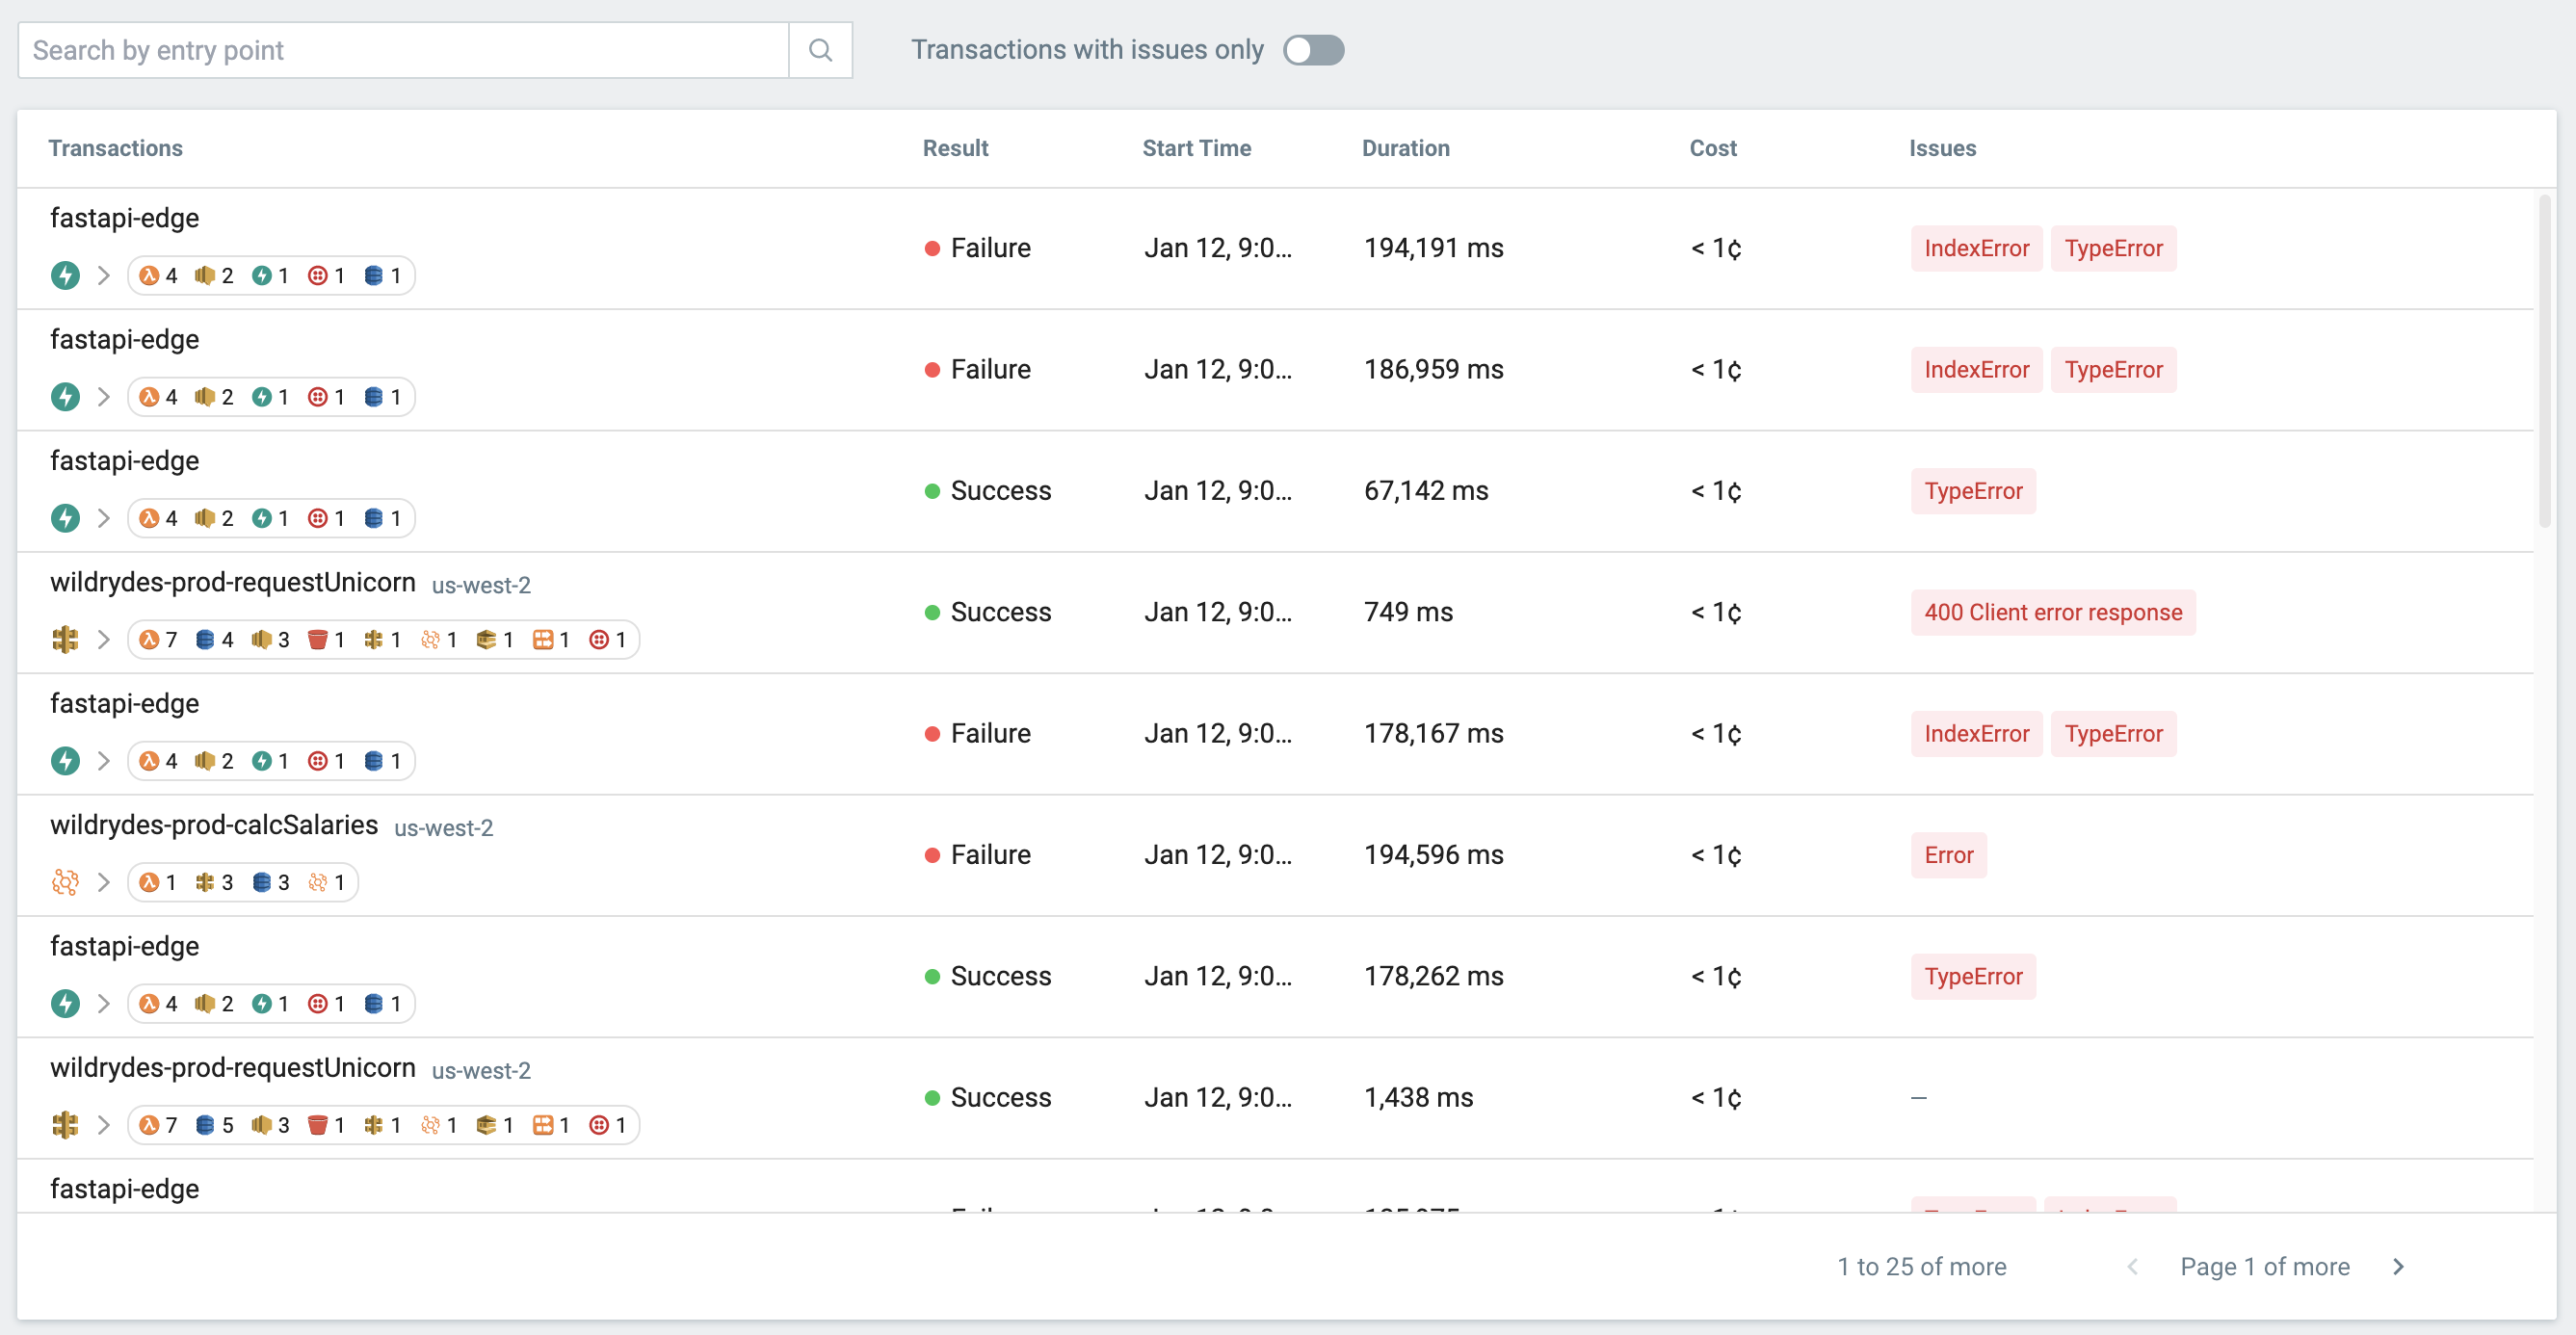
The Transactions view allows you to understand the health and performance of your distributed environment from a variety of angles, troubleshoot errors, understand the service latencies, and identify performance bottlenecks.

You can think of transactions as a representation of requests as they propagate from one service to the next in a distributed environment. This could be a direct result of a request initiated by a customer’s browser, but could also be initiated by a scheduled job or any other internal execution. An individual transaction consists of one or more requests.
For each transaction, the page displays:
- Entry point
- Services
- Start time
- Duration
- Cost
- Related issues
Explore Transaction
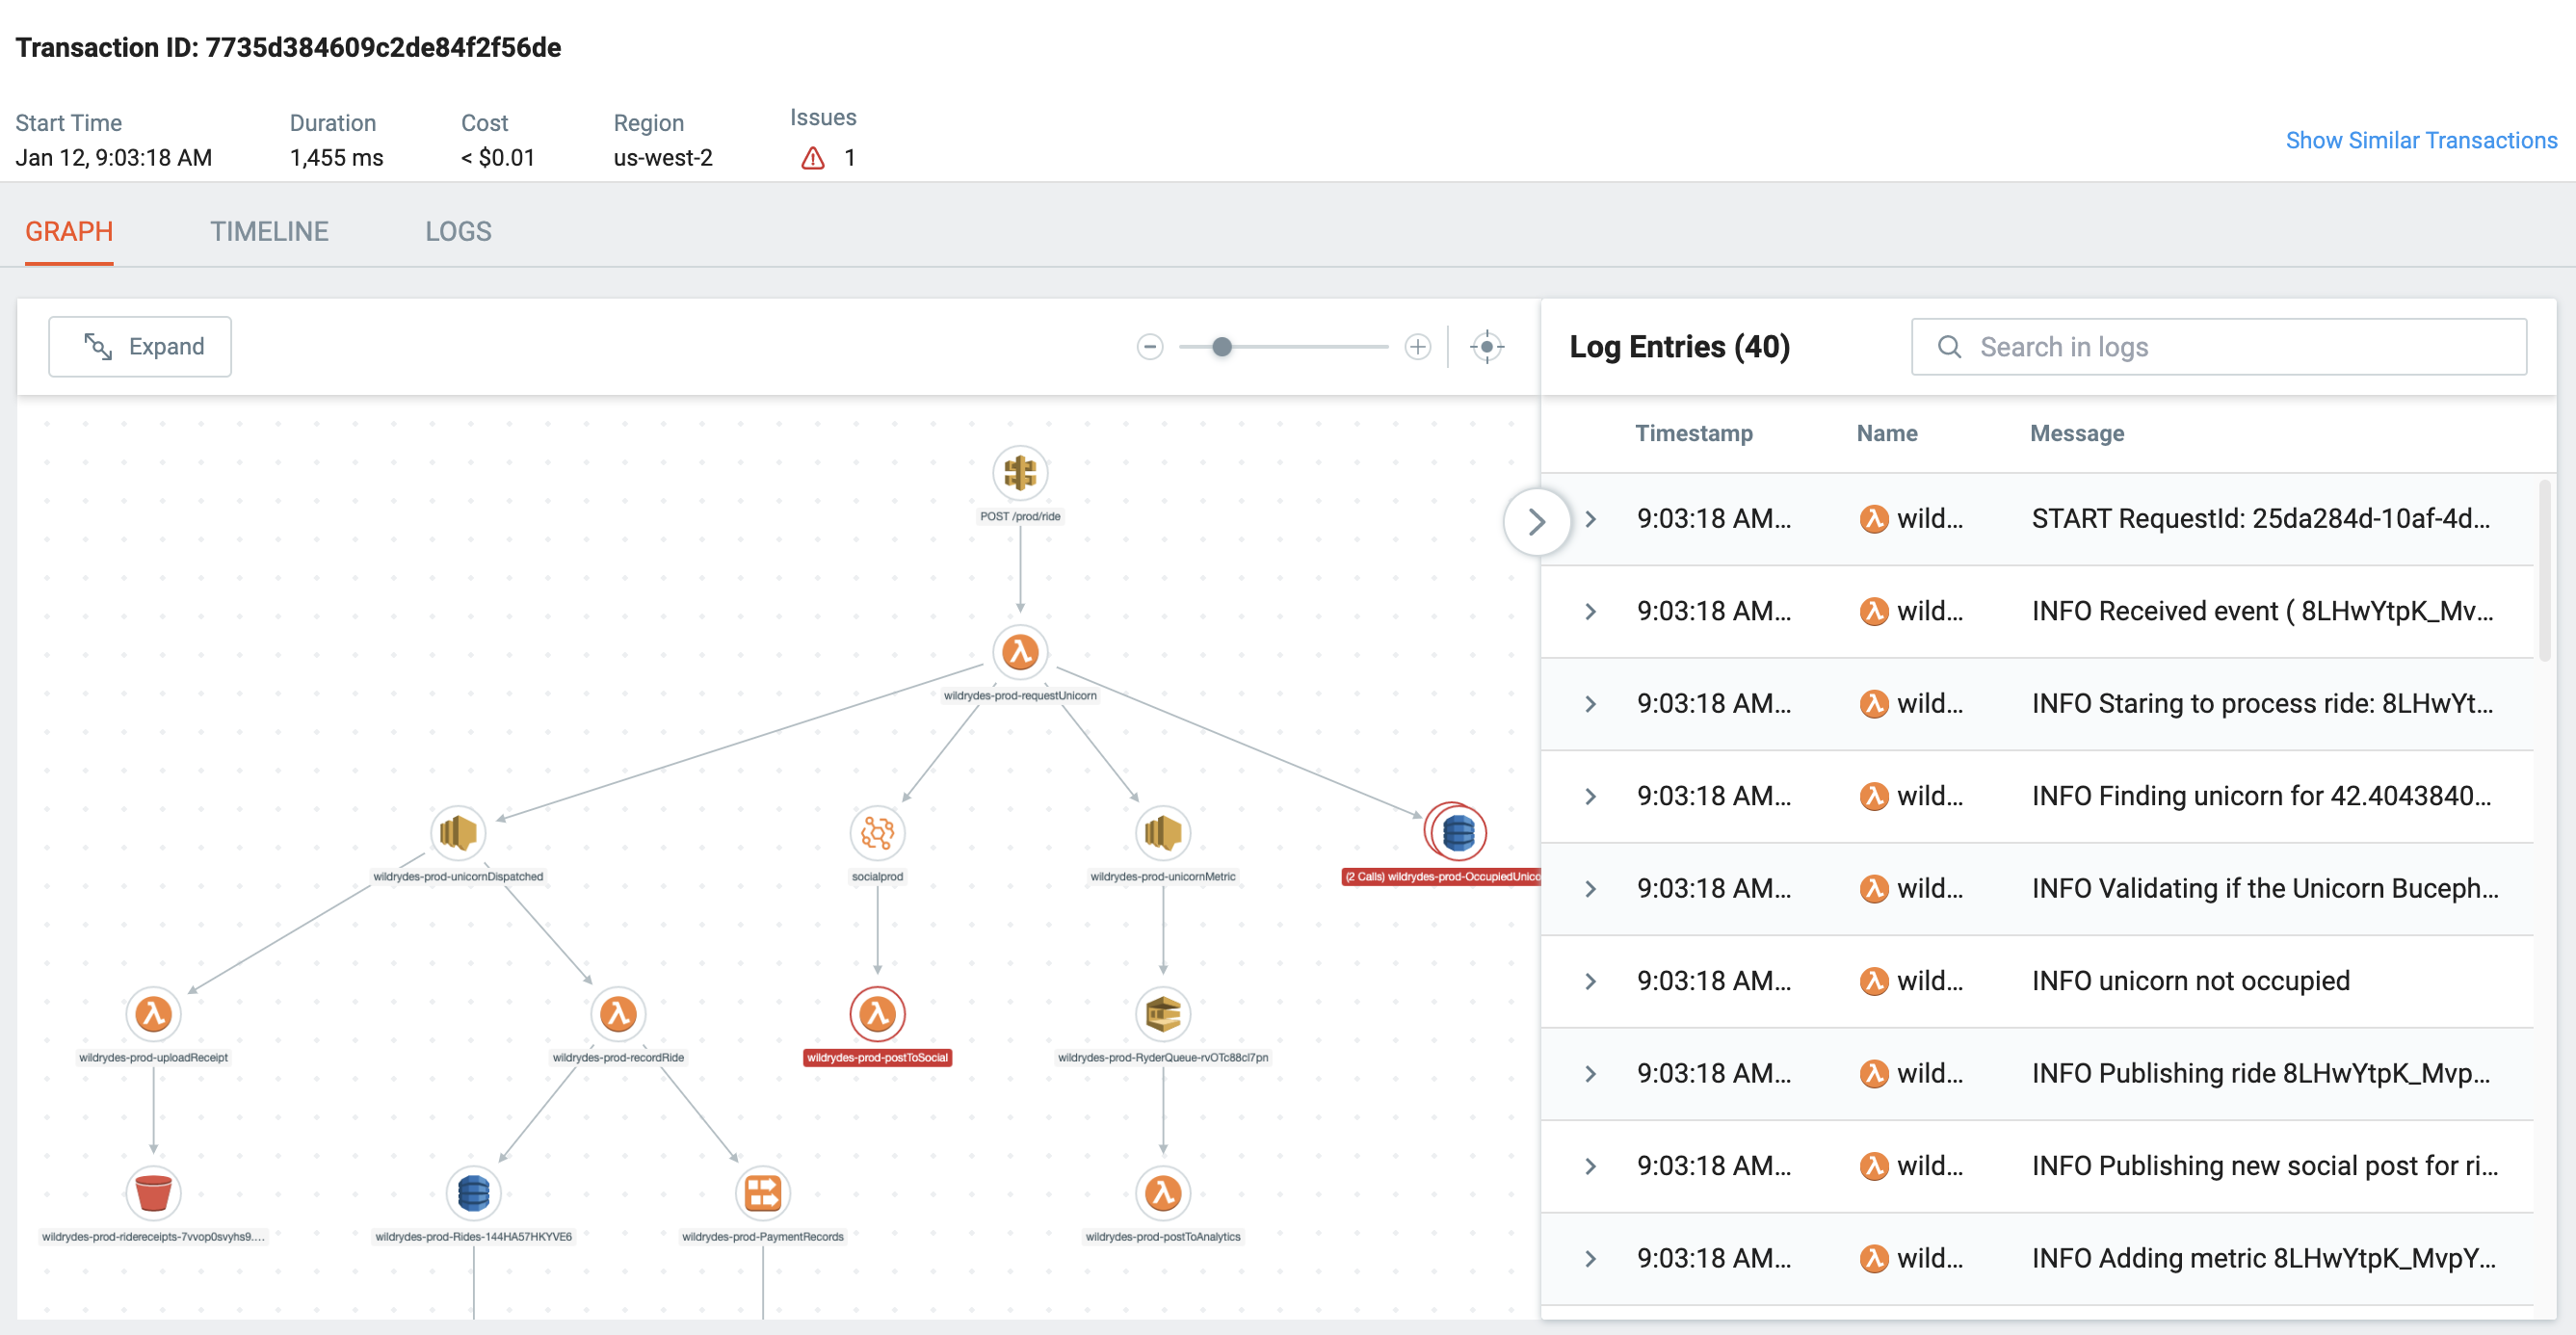
Click on the transaction you want to explore to open the a detailed view that includes a visualisation of requests as they propagate from one service to the next, requests and responses payload, logs, and metrics.

Learn more
Transaction View
Drill down into the details of requests as they propagate from one service to the next.
Transaction Graph
Observed dependencies between services and understand how data flows through your application.
Transaction Timeline
Explore performance bottlenecks, lengthy asynchronous calls, timeouts, and cold starts.
Transaction Logs
Review log entries collected from your applications that were part of the transaction.
Trace Details
Drill down into the stack trace, issues and the payload of requests and responses.
Updated about 1 year ago